

Employment Density Mapping of Dübendorf City Using GIS & Kernel Density Analysis

Employment Density Mapping of Dübendorf City Using GIS & Kernel Density Analysis

Employment Density Mapping of Dübendorf City Using GIS & Kernel Density Analysis

Project Overview

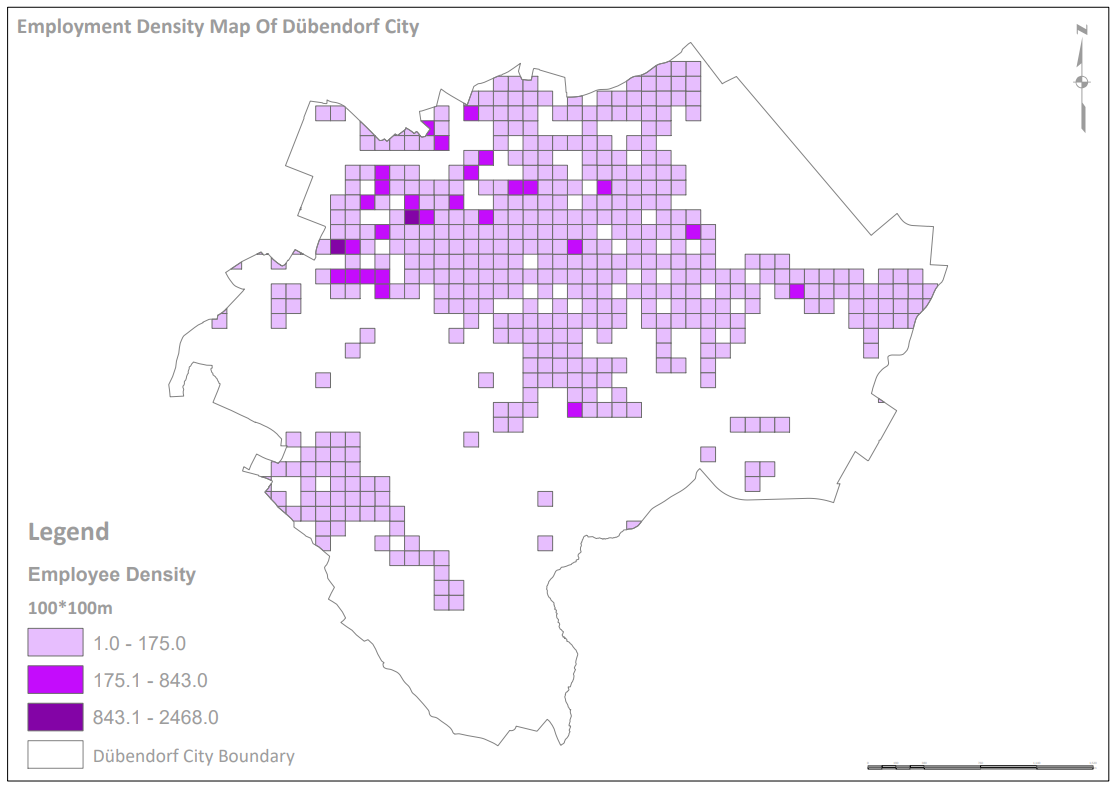
Understanding the spatial distribution of employment is critical for effective urban planning and economic development. In this project, Spatial Nexus developed a comprehensive employment density map for Dübendorf, transforming complex datasets into actionable geospatial insights.

The objective was to analyze and visualize the concentration of employment opportunities across the city, enabling planners, policymakers, and businesses to better understand the local economic landscape. By leveraging advanced GIS techniques, the project delivers a clear and data-driven representation of urban employment patterns.

The Challenge

Urban employment systems involve multiple interconnected factors, making analysis complex. Key challenges included:

  • Integrating diverse datasets such as business locations, demographics, and land use
  • Identifying meaningful employment clusters within dense urban environments
  • Representing employment intensity in an intuitive and visually clear format
  • Assessing accessibility to employment hubs via transportation networks
  • Delivering insights that support both strategic planning and business decisions

These challenges required a robust geospatial approach to ensure accuracy and usability.

Our Solution

Spatial Nexus implemented a comprehensive GIS-based methodology to address these challenges:

  • Collected and integrated spatial data including business locations, industrial zones, and commercial areas
  • Incorporated demographic statistics, transportation networks, and land use classifications
  • Utilized Kernel Density Estimation (KDE) to visualize employment intensity
  • Developed a high-quality map using ArcGIS and QGIS
  • Designed a clear, professional cartographic layout for stakeholder communication

This approach ensured a holistic and accurate representation of the city’s employment ecosystem.

The Impact

The project delivered significant value for urban and economic stakeholders:

  • Enhanced understanding of the city’s economic structure
  • Improved decision-making for urban planning and infrastructure development
  • Supported business location strategy and investment planning
  • Enabled data-driven policy formulation
  • Identified opportunities for future economic growth

This solution is highly applicable for smart city initiatives and regional development planning.

Technologies & Tools Used

  • ArcGIS - Spatial analysis and density modeling
  • QGIS - Data processing and visualization
  • GIS Datasets - Employment, demographics, land use, and transport networks
  • Microsoft Office - Reporting and data management

Skills & Capabilities Demonstrated

  • GIS & Spatial Analysis
  • Kernel Density Estimation (KDE)
  • Urban & Economic Analysis
  • Cartography & Data Visualization
  • Geospatial Data Integration

Key Features of the Employment Density Map

  • Hotspots & Clusters
  • Accessibility Analysis
  • Demographic Integration
  • Land Use Overlay
  • Future Growth Insights
Employment Density Map Of Dübendorf City

Why This Project Matters

Employment density is a key indicator of urban growth and economic vitality. This project highlights the importance of:

  • Visualizing economic activity through spatial data
  • Supporting sustainable urban development
  • Enhancing infrastructure and mobility planning
  • Enabling data-driven economic strategies

Spatial Nexus delivers intelligent geospatial solutions that bridge the gap between complex data and real-world decision-making.
Looking to Build GIS-Based Urban Analysis Solutions?

We help organizations design and implement advanced geospatial systems for urban planning, infrastructure, and economic development.

Contact Spatial Nexus Geospatial Consultancy to unlock the full potential of your spatial data.

GIS Data Visualization Specialist for Choropleth Map Series Using ArcGIS 10.8

GIS Data Visualization Specialist for Choropleth Map Series Using ArcGIS 10.8

GIS Data Visualization Specialist for Choropleth Map Series Using ArcGIS 10.8

Project Overview

Data visualization plays a critical role in transforming raw demographic data into meaningful spatial insights. In this project, Spatial Nexus delivered a comprehensive choropleth mapping solution using population data from the U.S. Census Bureau, focusing on all 159 counties in Georgia.

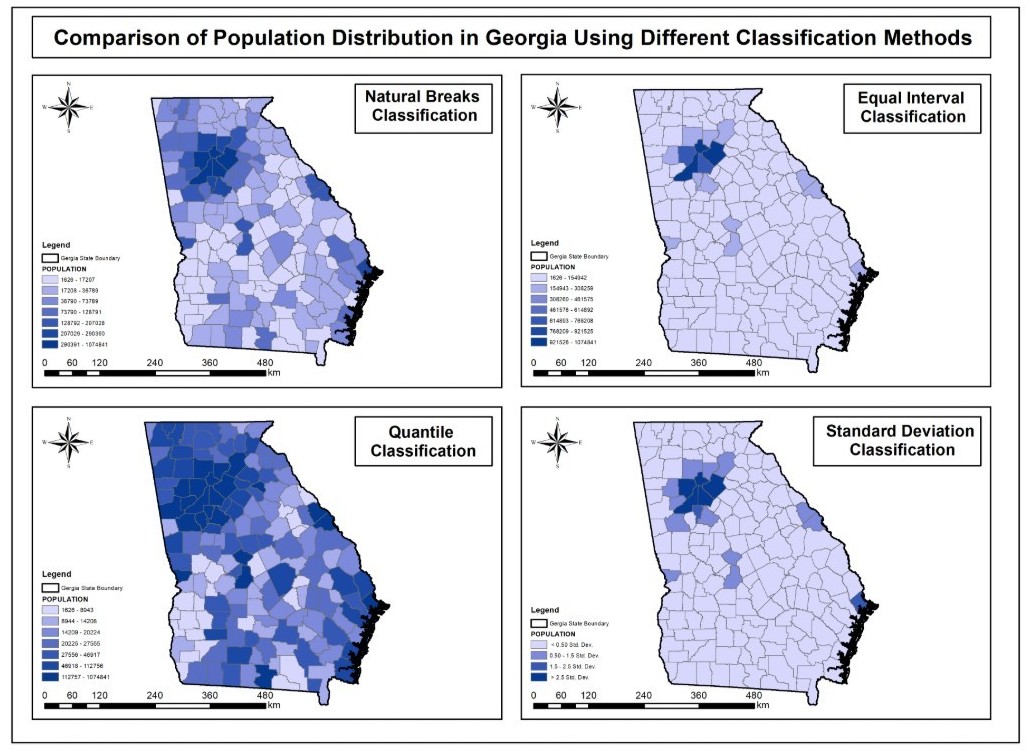
As a GIS Analyst, the objective was to design a comparative choropleth map series that highlights how different classification methods influence the interpretation of spatial patterns. Using ArcGIS 10.8, four distinct maps were created to ensure analytical depth and visual consistency.

The Challenge

Choropleth maps are widely used, but their effectiveness heavily depends on classification methods. Key challenges included:

  • Variability in data interpretation based on classification technique
  • Difficulty in selecting the most appropriate method for accurate representation
  • Maintaining visual consistency across multiple map outputs
  • Ensuring clarity for non-technical stakeholders
  • Avoiding misleading conclusions from improperly classified data

These challenges can significantly impact decision-making in planning, policy, and resource allocation.

Our Solution

Spatial Nexus implemented a structured GIS workflow to ensure accurate and insightful visualization:

  • Acquired and processed population datasets from the U.S. Census Bureau
  • Developed four choropleth maps using key classification techniques:
    • Equal Interval
    • Quantile
    • Natural Breaks (Jenks)
    • Standard Deviation

This approach enabled a clear comparison of how each method influences spatial pattern interpretation.

The Impact

The project delivered strong analytical and visual outcomes:

  • Improved understanding of population distribution patterns
  • Highlighted the importance of classification methods in GIS visualization
  • Enabled more informed decision-making for planners and analysts
  • Enhanced communication of complex data to non-technical audiences
  • Provided a reusable framework for future geospatial visualization projects

This solution is highly relevant for government agencies, urban planners, and data analysts working with demographic data.

Technologies & Tools Used

  • ArcGIS 10.8 – Spatial analysis and map production
  • Population Data – U.S. Census Bureau
  • GIS Classification Techniques – Statistical data grouping and visualization

Skills & Capabilities Demonstrated

  • GIS & Spatial Analysis
  • Choropleth Mapping & Thematic Cartography
  • Data Classification & Statistical Visualization
  • Cartographic Design & Layout Standardization
  • Report Writing & Insight Communication

Key Highlights

  • Comparative choropleth map series using four classification methods
  • High-quality cartographic design with consistent styling
  • Clean and professional PDF deliverable
  • Focus on both analytical accuracy and visual clarity
Key Highlights Comparative choropleth map series using four classification methods High-quality cartographic design with consistent styling Data-driven insights into classification impacts Clean and professional PDF deliverable Focus on both analytical accuracy and visual clarity

Why This Project Matters

Effective data visualization is essential for accurate spatial understanding. This project demonstrates the importance of:

  • Choosing the right classification method in choropleth mapping
  • Avoiding misleading visual interpretations
  • Enhancing clarity in demographic and statistical maps
  • Supporting data-driven policy and planning decisions

Spatial Nexus transforms raw data into clear, actionable geospatial intelligence for better decision-making.

Looking to Build Data-Driven GIS Visualization Solutions?

We help organizations design and deliver high-impact geospatial analytics and visualization systems for government, infrastructure, and urban planning.

Contact Spatial Nexus Geospatial Consultancy to turn your data into powerful spatial insights.

Replicate & Enhance U.S. National Park Service Map Using ArcGIS Pro

Replicate & Enhance U.S. National Park Service Map Using ArcGIS Pro

Replicate & Enhance U.S. National Park Service Map Using ArcGIS Pro

Project Overview

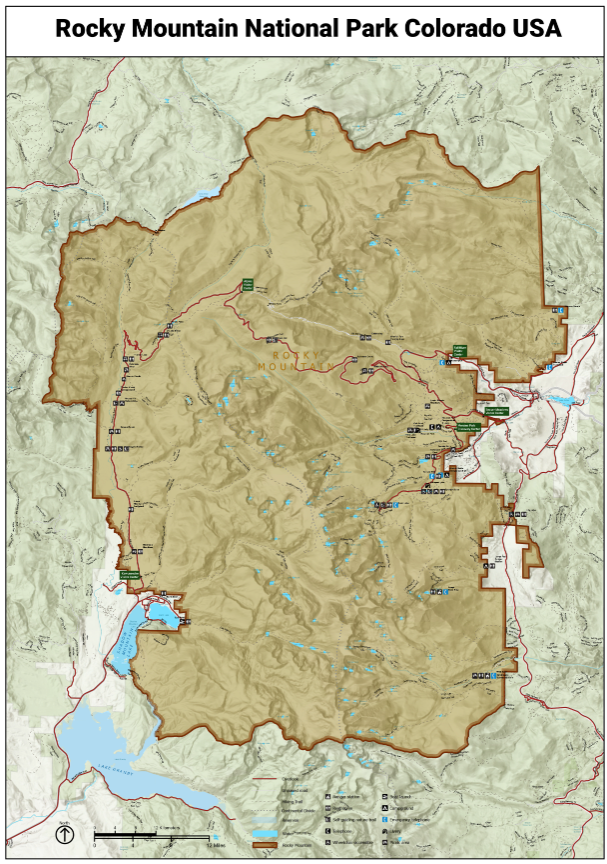
High-quality cartographic design is essential for effective communication in environmental management and tourism. In this project, Spatial Nexus replicated and enhanced maps developed by the National Park Service (NPS) using ArcGIS Pro to create a more refined, user-centric mapping solution.

The objective was to improve map readability, visual hierarchy, and spatial clarity while ensuring consistency with modern GIS cartographic standards. The enhanced maps were designed to better support park visitors, planners, and decision-makers by delivering clear and intuitive geographic insights.

The Challenge

Traditional park maps, while informative, often face limitations that impact usability and effectiveness:

  • Inconsistent symbology and color schemes reducing visual clarity
  • Overcrowded labeling leading to poor readability
  • Limited optimization for multi-scale viewing (print vs digital)
  • Lack of standardized cartographic hierarchy for key features
  • Difficulty in interpreting terrain, trails, and service locations

These challenges reduce the overall effectiveness of maps for navigation, planning, and visitor experience.

Our Solution

Spatial Nexus applied a data-driven cartographic design approach to replicate and significantly enhance NPS-style maps:

  • Recreated base maps using high-quality spatial data in ArcGIS Pro
  • Optimized labeling techniques for clarity and hierarchy
  • Applied advanced cartographic principles for better feature differentiation
  • Ensured map usability across both digital and print formats

This approach ensured that the final output is not only visually appealing but also functionally superior for real-world use.

The Impact

The project delivered measurable improvements in cartographic quality and usability:

  • Enhanced readability and user experience
  • Improved interpretation of geographic features and terrain
  • Better support for navigation and spatial decision-making
  • Increased accessibility for diverse user groups
  • Elevated visual standards aligned with modern GIS practices

This solution is highly valuable for environmental agencies, tourism authorities, and geospatial planning organizations.

Technologies & Tools Used

  • ArcGIS Pro Cartographic design and spatial data processing
  • GIS Data Sources Terrain, trails, and park infrastructure datasets
  • Digital Cartography Techniques Visualization and layout optimization

Skills & Capabilities Demonstrated

  • Advanced Cartography & Map Design
  • GIS Mapping & Spatial Visualization
  • Data Visualization & Layout Design
  • Symbology & Labeling Optimization
  • Spatial Data Structuring (Object-Relational Mapping)

Key Highlights

  • Advanced GIS-based cartographic enhancement
  • Standardized symbology and color optimization
  • Improved labeling and visual hierarchy
  • Multi-scale map design (print and digital ready)
  • User-focused map usability improvements
Replicate & Enhance U.S. National Park Service Map Using ArcGIS Pro

Why This Project Matters

As geospatial technologies evolve, high-quality map design becomes critical for:

  • Enhancing visitor experience in parks and tourism destinations
  • Supporting environmental planning and resource management
  • Improving spatial communication for decision-makers
  • Standardizing mapping practices across organizations

Spatial Nexus delivers intelligent cartographic solutions that transform complex spatial data into clear, actionable insights.

Looking to Build Advanced GIS Mapping Solutions?

We help organizations design and implement high-impact geospatial and cartographic systems for environmental management, infrastructure, and planning.

Contact Spatial Nexus Geospatial Consultancy to elevate your next GIS mapping project.

Client & Workforce Distribution Mapping Using GIS (Switzerland)

Client & Workforce Distribution Mapping Using GIS (Switzerland)

Client & Workforce Distribution Mapping Using GIS (Switzerland)

Project Overview

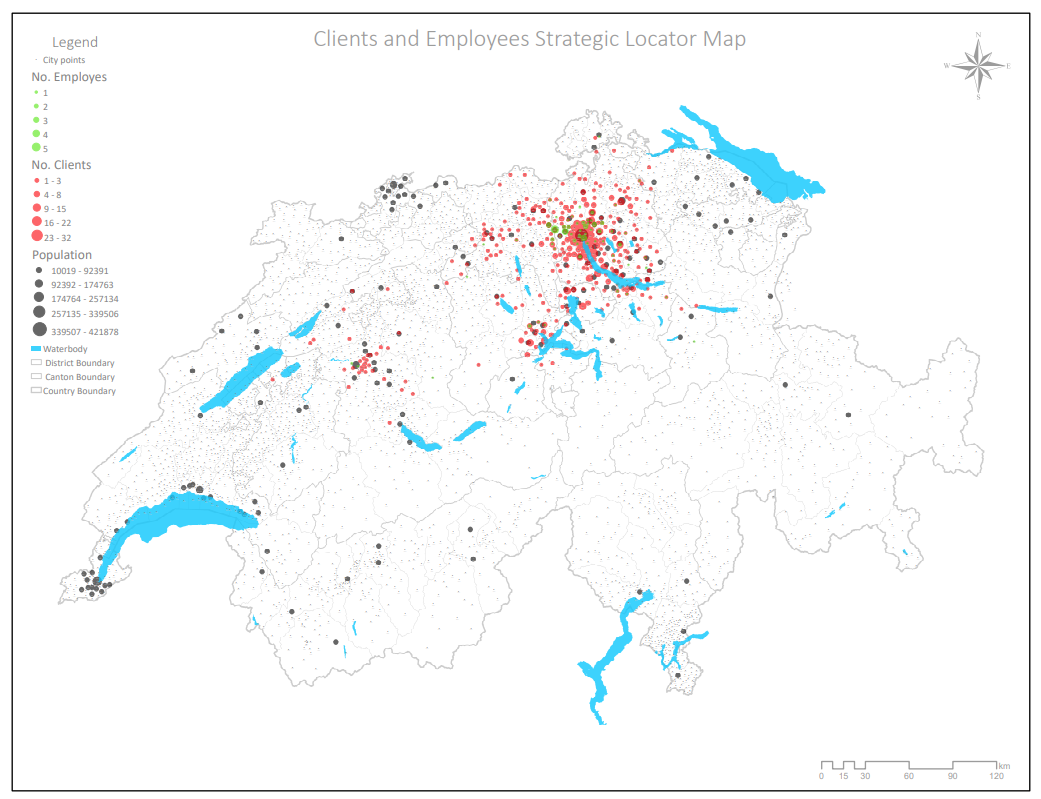
Understanding the spatial relationship between clients and workforce is critical for operational efficiency and service optimization. In this project, Spatial Nexus developed a comprehensive GIS-based strategy map for a cleaning services company in Switzerland, enabling clear visualization of client locations and employee distribution.

The objective was to transform raw operational data into an intelligent geospatial framework that supports data-driven decision-making and service area optimization.

The Challenge

The client faced limitations in understanding how their workforce and customer base were geographically distributed:

  • Lack of visibility into client concentration areas
  • Inefficient allocation of employees across service regions
  • Difficulty identifying high-demand clusters
  • Limited insights for expanding or optimizing service coverage

These challenges restricted the company’s ability to scale efficiently and maximize resource utilization.

Our Solution

Spatial Nexus implemented a GIS-driven spatial analysis and visualization approach to map and interpret the organization’s operational data:

  • Collected and structured client and employee location data
  • Client locations represented in red
  • Employee locations represented in blue
  • Cluster circles sized proportionally to reflect density and distribution
  • Delivered a visually intuitive and decision-ready GIS map

This solution enabled the organization to clearly understand its operational footprint and improve service planning.

The Impact

The project delivered actionable insights that significantly enhanced operational strategy:

  • Improved service area planning and workforce allocation
  • Identified high-demand clusters for targeted expansion
  • Reduced inefficiencies in employee deployment
  • Enhanced decision-making through clear geospatial visualization
  • Supported scalable growth with data-driven insights

Technologies & Tools Used

  • ArcGIS – Spatial analysis and mapping
  • QGIS – Data processing and visualization
  • GIS Infographic Tools – Cluster-based visualization
  • Microsoft Office – Data structuring and reporting

Skills & Capabilities Demonstrated

  • GIS Spatial Analysis
  • Geospatial Data Visualization
  • Cluster Mapping & Density Analysis
  • Image Processing & Cartography
  • Location Intelligence & Business Analytics

Key Highlights

  • Cluster-based visualization of clients and workforce
  • Color-coded mapping for intuitive interpretation
  • Scalable solution for operational optimization
  • Data-driven approach to service planning
  • Real-world business intelligence powered by GIS
Key Highlights Cluster-based visualization of clients and workforce Color-coded mapping for intuitive interpretation Scalable solution for operational optimization Data-driven approach to service planning Real-world business intelligence powered by GIS

Why This Project Matters

For service-based organizations, understanding where clients and resources are located is essential for efficiency and growth. This project demonstrates how GIS can transform operational data into strategic insights, enabling businesses to:

  • Optimize workforce distribution
  • Improve service coverage
  • Enhance customer satisfaction
  • Make informed expansion decisions

Spatial Nexus specializes in delivering location intelligence solutions that bridge the gap between data and strategy.

Looking to Optimize Your Operations with GIS?

We help organizations unlock the power of geospatial data to improve efficiency, planning, and decision-making.

Contact Spatial Nexus Geospatial Consultancy to build your next data-driven solution.

Wildfire Burn Severity Assessment Using NBR & dNBR (Remote Sensing Analysis)

Wildfire Burn Severity Assessment Using NBR & dNBR (Remote Sensing Analysis)

Wildfire Burn Severity Assessment Using Remote Sensing Analysis

Project Overview

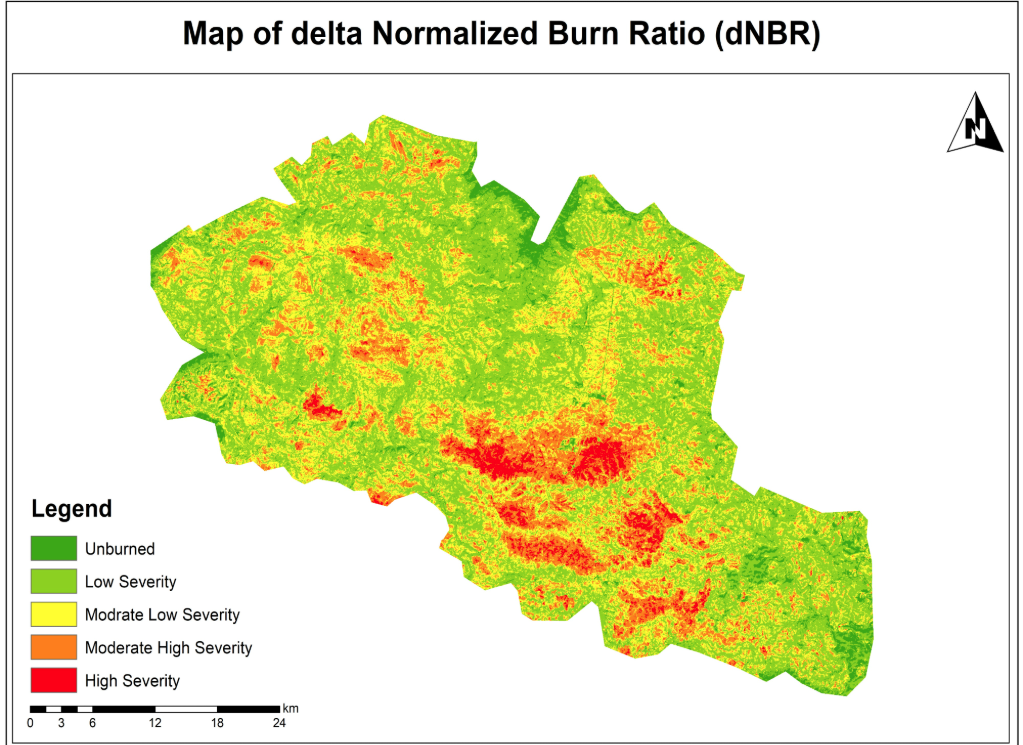
Monitoring wildfire impact is critical for environmental management, ecological recovery, and risk mitigation. In this project, Spatial Nexus conducted an advanced remote sensing analysis using Sentinel-2 satellite imagery to assess wildfire burn severity and post-fire vegetation recovery.

By leveraging Normalized Burn Ratio (NBR) and delta NBR (dNBR) techniques, we developed a data-driven framework to quantify damage and support rehabilitation planning and environmental decision-making.

The Challenge

Wildfire-affected regions require rapid and accurate assessment to guide recovery efforts. However, traditional methods face several limitations:

  • Delayed ground-based damage assessment
  • Lack of scalable monitoring over large geographic areas
  • Difficulty in quantifying burn severity consistently
  • Limited visibility into vegetation recovery over time

These challenges create gaps in timely response, ecological planning, and resource allocation.

Our Solution

Spatial Nexus implemented a multi-temporal satellite analysis workflow using Sentinel-2 data to evaluate wildfire impact and recovery:

  • Processed high-resolution Sentinel-2 imagery for pre- and post-fire analysis
  • Generated false-color composites to assess vegetation health
  • Normalized Burn Ratio (NBR) for burn detection
  • Delta NBR (dNBR) for burn severity classification

This approach enabled accurate, scalable, and repeatable wildfire impact assessment.

The Impact

The analysis delivered critical insights for environmental monitoring and recovery planning:

  • Identified high, moderate, and low burn severity zones
  • Enabled data-driven rehabilitation and reforestation strategies
  • Tracked vegetation recovery trends over time
  • Supported decision-making for government and environmental agencies
  • Demonstrated the power of remote sensing in disaster management

Technologies & Tools Used

  • Sentinel-2 Satellite Imagery – High-resolution Earth observation data
  • GIS Platforms – Spatial analysis and mapping
  • Google Earth – Visualization and validation
  • Remote Sensing Techniques – NBR & dNBR modeling

Skills & Capabilities Demonstrated

  • Remote Sensing Analysis
  • GIS & Spatial Data Processing
  • Image Classification & Interpretation
  • Georeferencing
  • Environmental & Disaster Analysis

Key Highlights

  • Multi-temporal wildfire analysis
  • Accurate burn severity classification using dNBR
  • Vegetation recovery monitoring
  • Scalable environmental assessment approach
  • Applicable to global wildfire-prone regions
Why This Project Matters With increasing wildfire incidents worldwide, geospatial technologies play a crucial role in: Rapid damage assessment and response Efficient ecosystem restoration planning Long-term environmental monitoring Supporting climate resilience strategies Spatial Nexus delivers advanced geospatial intelligence solutions that transform satellite data into actionable insights for governments and environmental organizations.

Why This Project Matters

With increasing wildfire incidents worldwide, geospatial technologies play a crucial role in:

  • Rapid damage assessment and response
  • Efficient ecosystem restoration planning
  • Long-term environmental monitoring
  • Supporting climate resilience strategies

Spatial Nexus delivers advanced geospatial intelligence solutions that transform satellite data into actionable insights for governments and environmental organizations.

Looking to Monitor Environmental Risks Using GIS?

We help organizations leverage remote sensing and GIS technologies for disaster management, environmental monitoring, and sustainable planning.

Contact Spatial Nexus Geospatial Consultancy to develop your next geospatial solution.