About this project
Project overview
Example workflow showing how Spatial Nexus approaches this type of analysis.
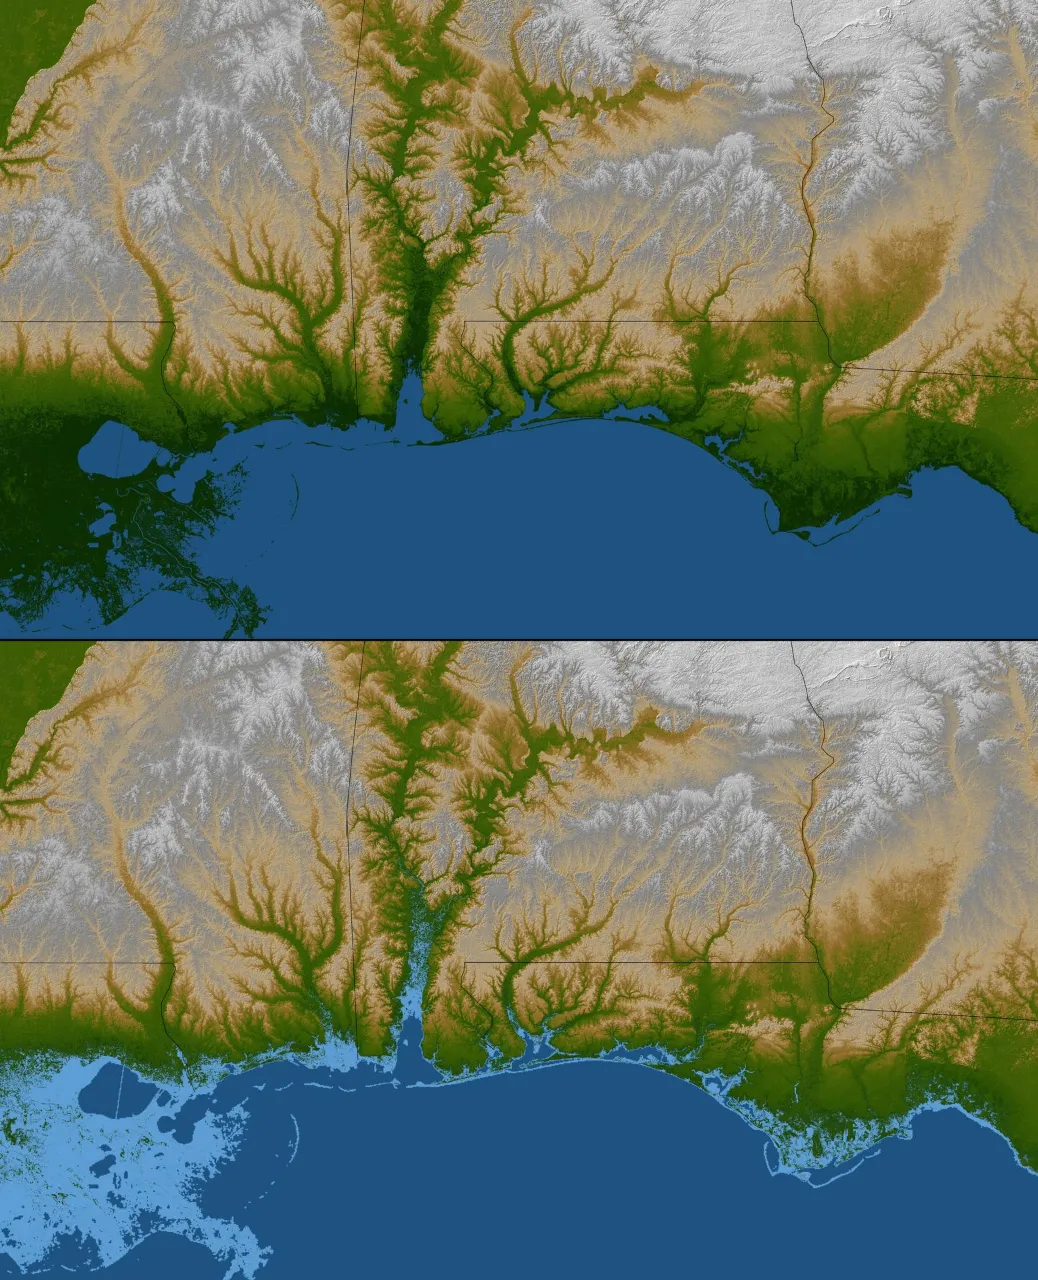
Terrain, land cover, rainfall and soil factors combined to map relative flood susceptibility.
This page shows a typical Spatial Nexus workflow for this type of analysis.
- flood susceptibility mapping
- flood risk GIS
- remote sensing flood mapping
- hydrological analysis
- disaster risk reduction GIS
Project at a glance
- Sector
- Environment
- Software
- QGIS, Google Earth Engine, ArcGIS Pro, Global Mapper, ERDAS IMAGINE
THE CHALLENGE
What needed solving
- Flood-prone areas must be identified before events occur.
- Evidence is needed to prioritise mitigation.
OBJECTIVES
What the project set out to do
- Combine terrain, drainage, rainfall and land cover.
- Produce a flood susceptibility map.
Methodology
Our workflow, step by step
01
Factors
Derive slope, elevation, distance to drainage and land cover.
02
Weighting
Weight factors using an agreed method.
03
Model
Combine into a susceptibility index.
04
Validation
Compare with recorded flood extents where available.
Visual output
The map
Select the image to view it at full size.
Results
What the analysis delivered
- Flood susceptibility classes from very low to very high.
- Validation against observed flood extents.
Key highlights
Why this project stands out
- Factors
- Weighting
- Model
- Validation
Data sources
Data used
- Elevation model and derived slope
- Drainage network
- Rainfall and land-cover data
- Historical flood extents from satellite imagery
Tools and technologies
Software and methods
Deliverables
What the client received
- Hazard and susceptibility maps
- Watershed and drainage layers
- Indicator time series
- Method and limitations note
FAQ
Questions about this project
What is flood susceptibility?
The relative likelihood that an area will flood, based on its physical characteristics.
How is it validated?
By comparing predicted zones with flood extents mapped from satellite imagery.
Related projects