About this project
Project overview
Monitoring wildfire impact is critical for environmental management, ecological recovery, and risk mitigation. In this project, Spatial Nexus conducted an advanced remote sensing analysis using Sentinel-2 satellite imagery to assess wildfire burn severity and post-fire vegetation recovery.
By leveraging Normalized Burn Ratio (NBR) and delta NBR (dNBR) techniques, we developed a data-driven framework to quantify damage and support rehabilitation planning and environmental decision-making.
- burn severity mapping
- dNBR remote sensing
- Sentinel-2 wildfire analysis
- Normalized Burn Ratio
- post-fire vegetation recovery
Project at a glance
- Client
- Environmental and disaster management
- Sector
- Environment
- Software
- Sentinel-2 Satellite Imagery, GIS Platforms, Google Earth, Remote Sensing Techniques
THE CHALLENGE
What needed solving
- Field surveys of large burned areas are slow, costly and sometimes unsafe.
- Decision-makers needed to know not only where the fire burned but how severely.
- Results had to support rehabilitation planning and long-term monitoring.
OBJECTIVES
What the project set out to do
- Map burn extent and severity from satellite imagery.
- Classify severity into standard classes.
- Provide a basis for monitoring post-fire vegetation recovery.
Methodology
Our workflow, step by step
01
Image selection
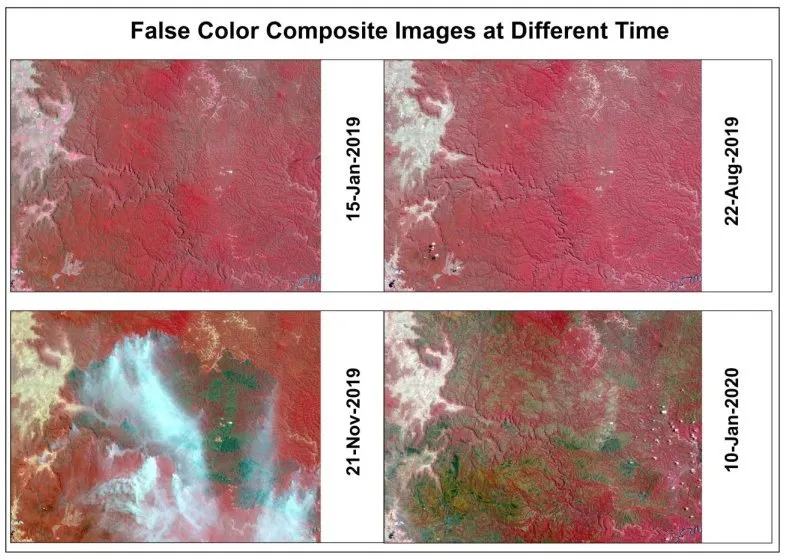
Cloud-free Sentinel-2 scenes were selected before and after the fire.
02
NBR calculation
The Normalized Burn Ratio was calculated for each date from near-infrared and shortwave-infrared bands.
03
dNBR differencing
Post-fire NBR was subtracted from pre-fire NBR to measure change.
04
Severity classification
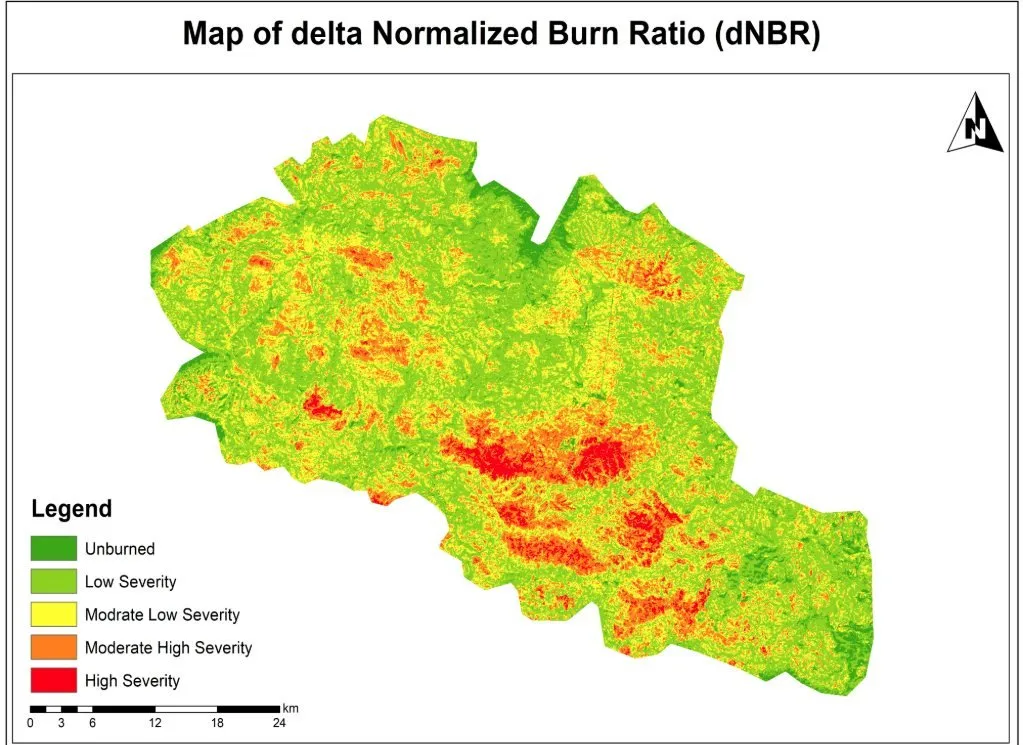
dNBR values were classified from unburned to high severity.
05
Validation and mapping
Results were checked visually against reference imagery and presented as a severity map.
Visual output
The map
Select the image to view it at full size.
Results
What the analysis delivered
- A burn severity map showing unburned, low, moderate-low, moderate-high and high severity zones.
- Clear identification of the most severely affected areas for priority action.
- A baseline for monitoring vegetation recovery over time.
Key highlights
Why this project stands out
- Sentinel-2 multispectral analysis
- NBR and dNBR modelling
- Five-class severity classification
- Supports recovery monitoring
Data sources
Data used
- Sentinel-2 pre-fire imagery
- Sentinel-2 post-fire imagery
- Google Earth reference imagery for validation
Tools and technologies
Software and methods
Deliverables
What the client received
- Burn severity map
- NBR and dNBR rasters
- Severity class statistics
- Method note
WHY IT MATTERS
Satellite-based burn severity mapping enables rapid damage assessment, targeted restoration and long-term environmental monitoring as wildfires become more frequent.
FAQ
Questions about this project
What is dNBR?
The differenced Normalized Burn Ratio, calculated by subtracting post-fire NBR from pre-fire NBR. Higher values indicate more severe burning.
Why use Sentinel-2?
It provides free 10–20 m imagery with the near-infrared and shortwave-infrared bands needed for NBR, revisiting every few days.
Can recovery be monitored?
Yes. Repeating the analysis over later seasons shows how vegetation returns.
Related projects