About this project
Project overview
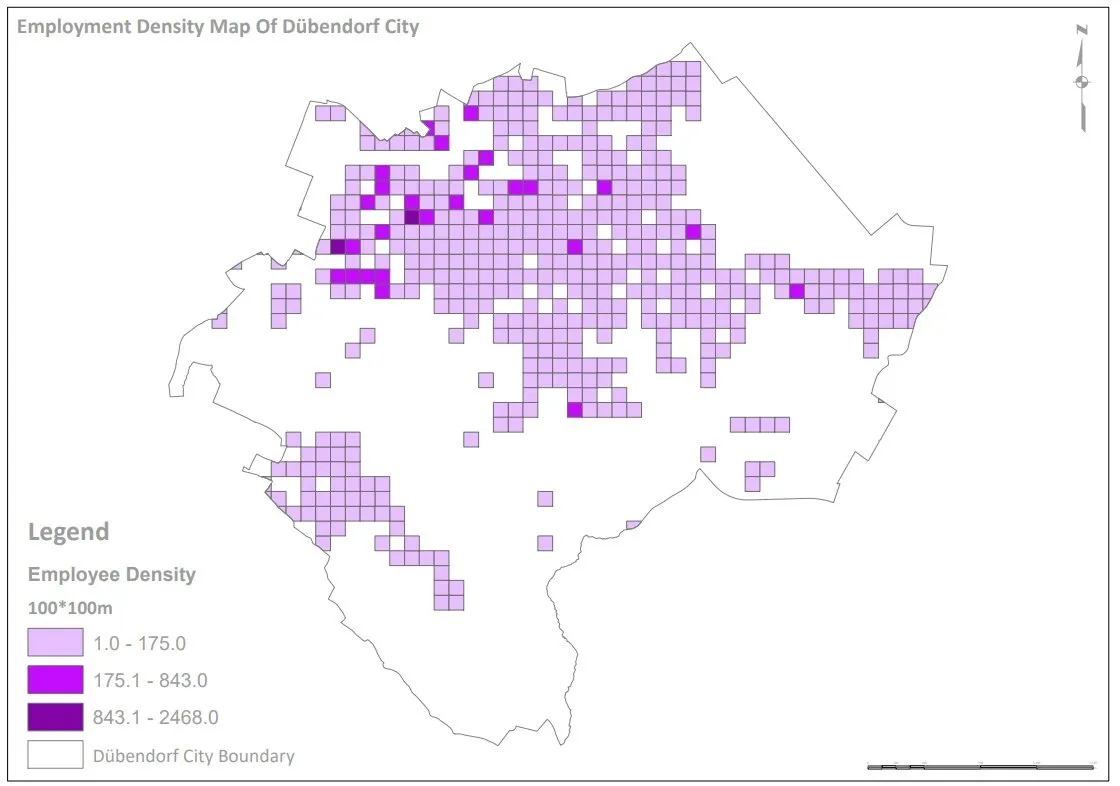
Understanding the spatial distribution of employment is critical for effective urban planning and economic development. In this project, Spatial Nexus developed a comprehensive employment density map for Dübendorf, transforming complex datasets into actionable geospatial insights.
The objective was to analyze and visualize the concentration of employment opportunities across the city, enabling planners, policymakers, and businesses to better understand the local economic landscape. By leveraging advanced GIS techniques, the project delivers a clear and data-driven representation of urban employment patterns.
- employment density mapping
- kernel density estimation GIS
- urban planning GIS
- economic geography analysis
- ArcGIS QGIS spatial analysis
Project at a glance
- Client
- Urban planning and economic development
- Sector
- Urban Planning
- Location
- Dübendorf, Switzerland
- Software
- ArcGIS, QGIS, GIS Datasets, Microsoft Office
THE CHALLENGE
What needed solving
- Employment, business and demographic data were held in separate tables with no spatial view.
- Planners could not see where jobs clustered or how employment related to transport and land use.
- Point-based records were too dense to interpret directly on a map.
OBJECTIVES
What the project set out to do
- Map the spatial distribution of employment across the city.
- Identify employment hotspots and lower-density areas.
- Relate job concentrations to transport networks and land-use zones.
- Deliver a clear, presentation-ready map for decision-makers.
Methodology
Our workflow, step by step
01
Data integration
Business, employment and demographic records were cleaned, geocoded and joined into one spatial database.
02
Projection and preparation
All layers were projected to a metric coordinate system so distances and search radii were accurate.
03
Kernel Density Estimation
KDE converted employment points into a continuous density surface, weighted by number of jobs.
04
Overlay analysis
The density surface was overlaid with transport and land-use layers to interpret why hotspots occur.
05
Cartographic design
A clear colour ramp, legend and context layers produced a readable, professional map.
Visual output
The map
Select the image to view it at full size.
Results
What the analysis delivered
- Clear identification of the main employment centres in Dübendorf.
- Visible relationship between job clusters, transport corridors and commercial zoning.
- Evidence base for infrastructure, transport and economic development planning.
Key highlights
Why this project stands out
- Kernel Density Estimation weighted by employment
- Integration of business, demographic and land-use data
- Transport and zoning overlays
- Presentation-ready cartography
Data sources
Data used
- Employment and business location records
- Demographic datasets
- Land-use zoning layers
- Transport network data
Tools and technologies
Software and methods
Deliverables
What the client received
- Employment density map (print and digital)
- Processed GIS datasets
- Density raster surface
- Methodology summary
WHY IT MATTERS
Employment density mapping gives planners an objective view of where economic activity happens, supporting decisions on transport investment, zoning and business development.
FAQ
Questions about this project
What is kernel density estimation in GIS?
KDE turns individual point locations into a smooth surface that shows how concentrated features are across an area, here weighted by the number of jobs at each location.
Which software was used?
ArcGIS for spatial analysis and density modelling, and QGIS for data processing and visualisation.
Can this analysis be applied to other cities?
Yes. The same workflow works for any city with geocoded employment or business data.
Related projects