
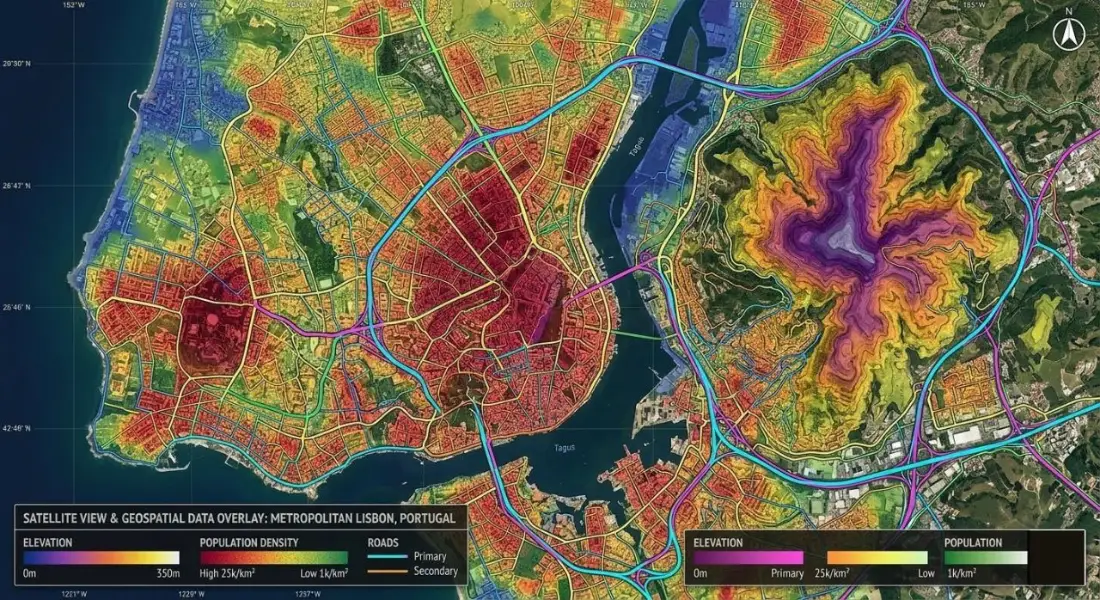
Key takeaways
- GIS links information about things with where those things are, so you can map, measure and analyse patterns.
- Data comes as vectors (points, lines, polygons) or rasters (grids of cells such as imagery and elevation), each with attributes.
- In short, the core analyses are overlay, buffering and proximity, density, networks, terrain and spatial statistics.
- QGIS is free and capable, whereas ArcGIS Pro is the industry standard in many organisations. Learning one makes the other easy.
- Good GIS work depends more on clean data and clear questions than on the software.
Most decisions have a "where" in them. Where should the new clinic go? Which neighbourhoods flood most often? Where are our customers, and how far do they travel? In other words, a geographic information system, or GIS, is the set of tools and methods used to answer questions like these by connecting information with location.
This guide is for people who are new to GIS: students weighing it as a career, managers running projects that use it, and anyone who wants to understand what their GIS colleagues actually do. Specifically, it covers what GIS is, how the data works, the main kinds of analysis, the software, where GIS is used and how to start learning.
What is GIS?
A GIS combines maps with databases. Every feature on the map, whether a road, a land parcel, a river, a tube well or a district, is linked to a record describing it. That link works in both directions. You can click a feature to see its information, or query the information, for example "all schools with more than 500 students", and see where those features are.
In addition, GIS lets you measure and analyse spatial relationships: which areas are within 2 km of a hospital, where businesses are concentrated, how land cover changed between 2015 and 2025, or which route between two points is shortest.
The idea is older than computers. For example, in 1854 the physician John Snow mapped cholera deaths in London and showed that they clustered around one water pump, a classic early example of spatial analysis. Later, in the 1960s, Roger Tomlinson developed the first computerised GIS, the Canada Geographic Information System, to inventory land resources. Today GIS runs on desktops, servers, phones and in the cloud.
The five things a GIS does
- Capture location data from GPS, surveys, drones, satellite imagery, scanned maps and address lists.
- Store and manage it in a structured spatial database or file format, with consistent attributes and coordinate systems.
- Analyse relationships using overlay, distance, density, networks, terrain and statistics.
- Visualise results as maps, charts, 3D scenes and dashboards.
- Share outputs as printed maps, reports, web maps and data services.
How GIS data works
Vector data
Vector data represents discrete features with geometry:
- Points for things with a single location, such as wells, shops or sample sites.
- Lines for linear features, such as roads, pipelines and rivers.
- Polygons for areas, such as parcels, lakes, districts and land-use zones.
For example, common vector formats include the shapefile, GeoPackage, GeoJSON and file geodatabase. However, GeoPackage is a good default today: a single, open file that holds many layers.
Raster data
In contrast, raster data divides the area into a grid of cells, each holding a value. For instance, satellite images, aerial photos, elevation models, rainfall surfaces and land-cover maps are rasters. Moreover, the cell size, or resolution, determines the level of detail: a 10 m Sentinel-2 image shows fields, a 30 cm aerial photo shows individual cars.
Attribute data
Attributes describe each feature: a road's name, type and surface; a district's population and area; a parcel's owner and land use. Attribute tables can be joined with other tables, such as census data, using a shared key. Therefore, clean, consistent attributes are what make analysis possible. Many GIS projects spend more time fixing attributes than drawing maps.
Coordinate reference systems
In addition, every dataset uses a coordinate reference system that defines how positions on the curved Earth become numbers. Latitude and longitude in WGS 84 are common for sharing data, but measuring distance and area needs a projected system in metres, such as the local UTM zone. In fact, mismatched coordinate systems are the most common reason layers do not line up. Our guide to choosing a coordinate reference system covers this in detail.
The main types of GIS analysis
| Analysis | Typical question |
| Overlay | Which parcels fall inside the flood zone? |
| Buffer and proximity | How many households are within 1 km of a school? |
| Density and hot spots | Where are crimes, customers or jobs concentrated? |
| Network analysis | What is the fastest route, and which areas can be reached in 15 minutes? |
| Terrain analysis | Where are slopes too steep to build? Where does water flow? |
| Suitability modelling | Where is the best place for a solar farm? |
| Change over time | How much farmland became built-up land in ten years? |
| Spatial statistics | Is this pattern clustered, or could it be random? |
GIS software
- QGIS is free, open source and runs on Windows, macOS and Linux. Also, it handles mapping, analysis and data management for most projects and has a large plugin library.
- ArcGIS Pro from Esri is the standard in many governments, utilities and large companies, with extensive tools, extensions and support.
- ArcGIS Online, Leaflet, MapLibre and OpenLayers let you publish interactive maps on the web.
- PostGIS adds spatial functions to the PostgreSQL database for large, multi-user datasets.
- Python with GeoPandas, Shapely and rasterio automates analysis and processes large volumes of data.
- Google Earth Engine processes satellite imagery archives in the cloud.
However, the concepts are the same across all of them. As a result, someone who understands overlay, projections and attribute joins in QGIS can move to ArcGIS Pro in days.
Why GIS matters
A table of 159 county statistics is hard to read. However, the same numbers on a well-designed map show the pattern in seconds. That is the simplest value of GIS: it makes spatial patterns visible. Beyond that, it makes them measurable, so a planner can say not just "the east side is underserved" but "42,000 people live more than 30 minutes from a health facility, mostly in these five union councils".
Our choropleth map series for Georgia's 159 counties and the employment density map of Dübendorf are two examples of the same data becoming a clear picture for planners and decision-makers.
GIS applications across industries
Urban planning and local government
Land-use zoning, building permits, service coverage, property tax records, transport planning and infrastructure inventories.
Environment and natural resources
Habitat mapping, watershed analysis, pollution tracking, forest inventories and environmental impact assessment.
Utilities and infrastructure
Mapping pipes, cables and assets, planning maintenance, and converting CAD drawings into GIS layers, as in our CAD-to-GIS asset layer project.
Transport and logistics
Route optimisation, delivery zones, accident analysis and network planning, such as our bike route network analysis.
Public health
Disease mapping, access to health facilities, vaccination coverage and identifying vulnerable populations.
Agriculture
Field boundaries, soil and climate suitability, crop monitoring with satellite imagery and irrigation planning.
Disaster management
Hazard mapping, evacuation planning and rapid damage assessment after floods, earthquakes and fires.
Business and location intelligence
Store location, market analysis, customer segmentation and territory planning.
Getting started with GIS
- Install QGIS. Also, it is free and has everything a beginner needs.
- Get some open data. Administrative boundaries from geoBoundaries or GADM, roads and buildings from OpenStreetMap, and elevation from Copernicus DEM or SRTM.
- Make a few maps. A choropleth of population by district, a map of roads by type, a hillshade of your region. Then focus on clear colour, labels and a legend.
- Learn the core tools. Attribute joins, spatial joins, buffers, clipping, dissolving and reprojecting.
- Understand coordinate systems early. It will save you hours of confusion.
- Finally, do a small project from start to finish. Pick a real question, such as access to parks in your city, and answer it with a map and a short write-up.
- Add Python and remote sensing when you are comfortable. In fact, they are what turn GIS skills into a career.
If your organisation is starting to use GIS, or needs training for staff, our GIS and consultancy and technical support teams can help set up data, workflows and skills that last beyond a single project.
Frequently asked questions
What does GIS stand for?
GIS stands for geographic information system. Some people also use it for geographic information science, the academic field that studies spatial data, methods and their limits. In everyday use it means the combination of software, data, methods and people used to work with location-based information.
Is GIS the same as GPS?
No. GPS is a satellite positioning system that tells a receiver where it is. GIS is the system used to store, analyse and map location data, which may include positions collected with GPS. In other words, GPS is one of many data sources a GIS uses, along with surveys, satellite imagery, scanned maps, census tables and spreadsheets with addresses.
What skills do I need to learn GIS?
To begin with, focus on spatial thinking and basic data handling: tables, joins and clean attribute data. Then learn a desktop GIS, map design and the main analysis tools. Coordinate systems deserve early attention because they cause many beginner errors. As you progress, Python, SQL with PostGIS and remote sensing skills open up automation and larger projects.
Which industries hire GIS professionals?
Local and national government, urban planning, utilities, telecommunications, transport, environmental consultancies, agriculture, forestry, mining, oil and gas, insurance, logistics, real estate, public health, humanitarian organisations and defence all employ GIS specialists. Many people also use GIS as one part of a wider role, such as planner, engineer, ecologist or data analyst.
Is GIS hard to learn?
The basics are not. Generally, most people can make a clear thematic map in QGIS within a few days. Becoming good at analysis takes longer, because the hard part is choosing the right method and data for a question and recognising when a result does not make sense. However, that judgement comes with practice on real projects.
Related articles
How to Choose the Right Coordinate Reference System (CRS) for GIS Projects
A practical guide to coordinate reference systems, map projections, UTM and WGS 84, and how the right CRS keeps distance, area and network analysis accurate.