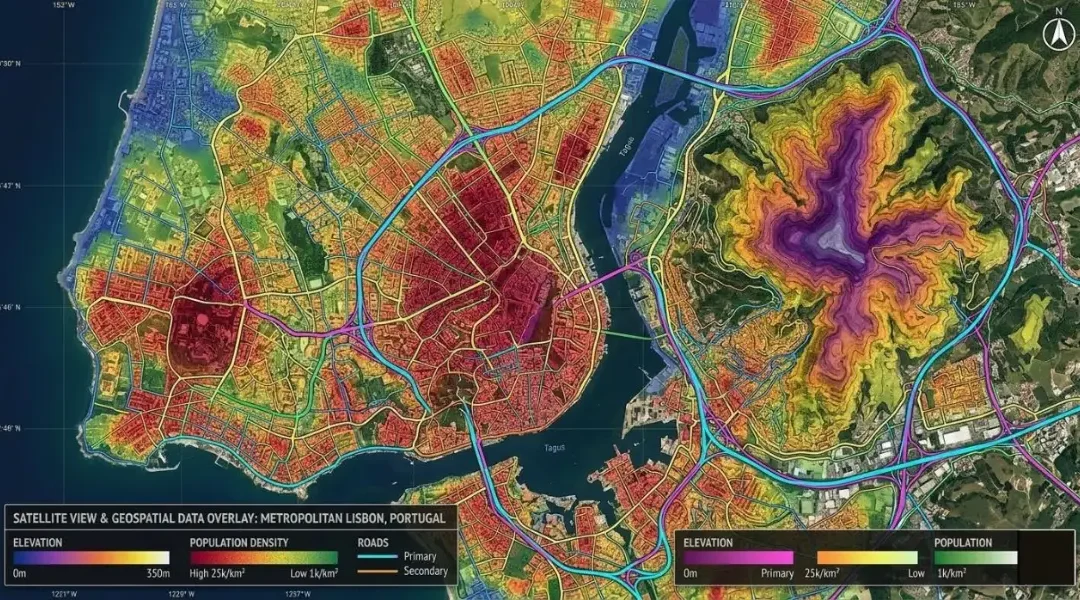
A practical guide to coordinate reference systems, map projections, UTM and WGS 84, and how the right CRS keeps distance, area and network analysis accurate.
How to Choose the Right Coordinate Reference System (CRS) for GIS Projects
Key takeaways
- WGS 84 (EPSG:4326) is a geographic system in degrees. It is fine for storing and sharing data, but not for measuring distance or area.
- For a city or district, the local UTM zone or the national grid is therefore almost always the right working CRS.
- Equal-area projections are the safe choice for area statistics over large regions; Web Mercator is for display only.
- "Define projection" labels data, "Project" moves it. In fact, confusing the two is the most common CRS error we fix.
- Above all, agree the CRS with the client at the start of a project and record it, with its EPSG code, in the metadata.
Every GIS layer carries a coordinate reference system, whether anyone has looked at it or not. The CRS defines how a point on the curved surface of the Earth is written down as a pair of numbers. Get it right and layers from different sources line up, buffers are the size you asked for and area statistics are correct. Get it wrong and the errors are often silent: the map looks fine, but a 500 m buffer is really 420 m, or a land-cover total is off by several percent.
This guide explains the concepts you actually need, a practical way to choose a CRS, and the mistakes we see most often when we take over projects from other teams.
The building blocks: ellipsoid, datum and projection
Three ideas sit behind every CRS.
- Ellipsoid. A mathematical model of the Earth's shape, slightly flattened at the poles. For example, GRS 80 and WGS 84 are the two most common and differ by only a fraction of a millimetre.
- Datum. The ellipsoid plus a definition of where it sits relative to the real Earth. Older local datums, such as Everest 1830-based systems used across South Asia, were fitted to one country and can be offset from WGS 84 by hundreds of metres.
- Projection. The mathematical rule for flattening the curved surface onto a plane. However, every projection distorts something: area, shape, distance or direction. Therefore, you choose which distortion matters least for your purpose.
Geographic vs projected coordinate systems
A geographic CRS stores positions as latitude and longitude in degrees. WGS 84 (EPSG:4326) is the one most people use, because GPS receivers and most web services work in it. The problem for analysis is that a degree is not a fixed distance. A degree of latitude is about 111 km everywhere, but a degree of longitude is 111 km at the equator, about 95 km at Lahore and about 75 km at Zürich. As a result, measuring length or area in degrees gives meaningless results.
A projected CRS flattens the Earth and stores coordinates in metres (or feet). Distances, buffers and areas calculated in a suitable projected CRS are reliable, provided the study area is within the zone the projection was designed for.
The systems you will meet most often
| CRS | EPSG | Type | Typical use |
| WGS 84 | 4326 | Geographic | GPS data, data exchange, global datasets |
| Web Mercator | 3857 | Projected | Web map display only |
| WGS 84 / UTM zone 43N | 32643 | Projected | Lahore, Islamabad, much of Punjab |
| WGS 84 / UTM zone 42N | 32642 | Projected | Karachi, most of Sindh and Balochistan |
| CH1903+ / LV95 | 2056 | Projected | Switzerland national grid |
| ETRS89 / LAEA Europe | 3035 | Projected, equal area | Pan-European statistics |
Universal Transverse Mercator (UTM)
UTM divides the world into 60 zones, each 6° of longitude wide, numbered eastward from 180° W. Each zone has its own transverse Mercator projection with a false easting of 500,000 m and a scale factor of 0.9996 on the central meridian. Within a zone, however, scale distortion stays below about one part in a thousand, which is accurate enough for almost all planning and environmental work.
The limitation is the zone edge. Pakistan, for example, spans zones 41 to 44. In contrast, a national analysis forced into a single UTM zone will have growing distortion towards the far edges.
National grids
For this reason, many countries define their own projected system, tuned to their territory and linked to a national datum. Switzerland's LV95 and Great Britain's OSGB36 National Grid are familiar examples. Government, engineering and cadastral clients usually require the national grid, and it is often more accurate locally than UTM.
Why the CRS matters for analysis
- Buffers and distances. A 500 m buffer is only 500 m in a projected CRS measured in metres.
- Area. Similarly, land-cover totals and parcel areas need a low-distortion or equal-area projection. Web Mercator overstates area by about 38 percent at the latitude of Lahore and by more than double at the latitude of Zürich.
- Density analysis. Kernel density search radii are distances, so they inherit any distortion in the CRS.
- Network analysis. Likewise, route lengths, travel times and slope-based costs depend on consistent metric coordinates.
- Data integration. CAD drawings, surveys, GPS points and imagery only line up when their systems are known and transformed correctly.
How to choose a CRS for your project
1. Look at the size and shape of the study area
For a city, district or project site, use the local UTM zone or the national grid. For a whole country that crosses several UTM zones, use the national projection if one exists, or an equal-area projection centred on the country, such as a custom Albers or Lambert Azimuthal Equal Area.
2. Match the projection to the measurement that matters
Equal-area projections preserve area and are the right choice for land-cover statistics and density per square kilometre. Conformal projections, such as UTM and Lambert Conformal Conic, preserve local shape and angles, which suits engineering and navigation. In contrast, equidistant projections preserve distance from one point or along certain lines.
3. Follow client and national standards
If the client's engineers, surveyors or GIS department work in a specific system, deliver in that system. Agreeing this on day one avoids costly reprojection at the end, especially where CAD is involved.
4. Separate storage, analysis and display
A workflow we use often: keep source data in WGS 84 for exchange, run all analysis in the project's projected CRS, and publish to the web in Web Mercator. In other words, each stage uses the system that suits it.
5. Write it down
Record the CRS name and EPSG code in the project metadata and in file names where helpful. Six months later, nobody will remember which of three similar UTM variants the team used.
Case example: accurate distances in network and density analysis
In our bike route network analysis, OpenStreetMap roads arrive in WGS 84. Before building the network, we projected all layers to a metric CRS so that segment lengths, slope from the elevation model and terrain-aware travel costs were all in true metres. In the employment density mapping of Dübendorf, all layers were processed in a metric projected system, so the kernel density search radius represented a real walking-scale distance. Without those steps, both analyses would have looked plausible and been quietly wrong.
Common CRS mistakes to avoid
- Defining instead of projecting. "Define Projection" in ArcGIS, or "Assign Projection" in QGIS, only changes the label. Use it when the label is missing or wrong. To convert coordinates from one system to another, use "Project" or "Reproject Layer".
- Measuring in degrees. Consequently, lengths and areas calculated in EPSG:4326 are not meaningful in metres.
- Ignoring the datum transformation. Moving between an old local datum and WGS 84 needs the right transformation. However, picking the default can leave layers tens to hundreds of metres apart.
- Trusting on-the-fly display. Also, desktop GIS reprojects layers for display, which hides mismatches. Check the CRS of each layer before running analysis.
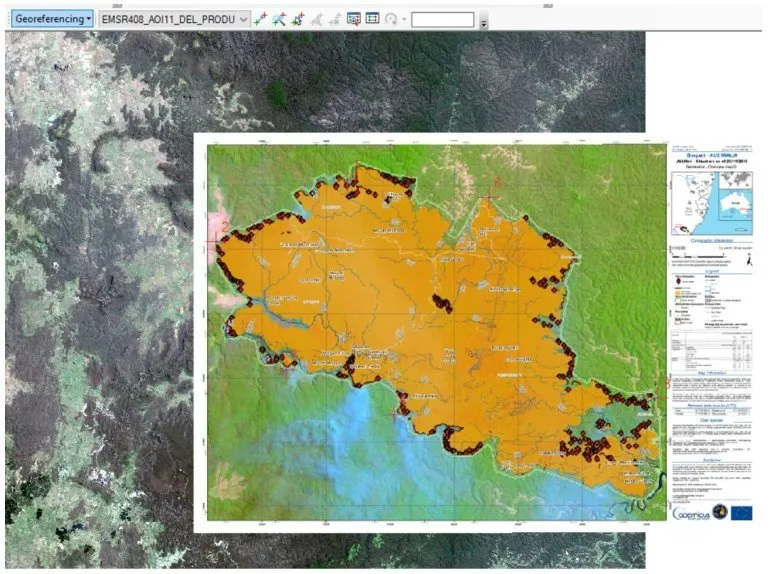
- CAD files with no coordinate system. Drawings in a local site grid must be georeferenced or transformed before they can be combined with GIS data.
- Repeated raster reprojection. In addition, each resampling step degrades the data a little. Reproject rasters once, with the right resampling method.
A quick checklist before you start analysis
- Check the CRS of every input layer, and confirm that it is correct, not just present.
- Choose one projected working CRS suited to the area and purpose.
- Reproject all inputs into it, using the correct datum transformation.
- Run a sanity check: measure a known distance, such as a road between two junctions, and compare it with a trusted source.
- Record the CRS and transformation in the project notes.
Coordinate systems are not glamorous, but they sit underneath every number a GIS produces. If you are integrating CAD, survey and GIS data, or need a second opinion on an inherited dataset, our GIS and infrastructure and engineering GIS teams can sort out the projections before they cause problems.
Frequently asked questions
Is WGS 84 a projection?
No. WGS 84 in its usual form (EPSG:4326) is a geographic coordinate system: it stores latitude and longitude in degrees on an ellipsoid. A map drawn directly from it uses a simple plate carrée display, but the data itself is unprojected. WGS 84 is also the datum underlying many projected systems, such as the WGS 84 / UTM zones.
Which UTM zone covers Lahore?
Lahore, at about 74.3° E, falls in UTM zone 43 North, which runs from 72° E to 78° E. Therefore, on WGS 84 its EPSG code is 32643. Islamabad is also in zone 43, while Karachi, at about 67° E, is in zone 42 (EPSG:32642).
Can I change the CRS of my data later?
Yes. You can reproject vector and raster data at any time with QGIS, ArcGIS Pro or GDAL. Reprojecting vectors is close to lossless. Reprojecting rasters involves resampling, so do it as few times as possible and choose the method carefully: nearest neighbour for classified data, bilinear or cubic for continuous data such as elevation.
What CRS should I use for a web map?
Most online basemaps use Web Mercator (EPSG:3857), so web map libraries display data in it by default. Keep your analysis in a proper projected CRS and let the web platform reproject for display. Never measure areas in Web Mercator, because distortion increases quickly away from the equator.
Why are my layers in the right place in QGIS but offset when I open them in CAD?
However, most CAD software does not reproject on the fly. If the drawing was created in a local site grid or a different national system, it will not line up with GIS layers until you transform it. Ask for the coordinate system the surveyor used, then transform the GIS data or georeference the drawing with known control points.
Need help applying this to your project?Talk to Spatial Nexus about geographic information systems (gis) for your area and data.
Related articles
How to Choose the Right Coordinate Reference System (CRS) for GIS Projects
read more about How to Choose the Right Coordinate Reference System (CRS) for GIS Projects
What Is GIS? A Complete Beginner’s Guide to Geographic Information Systems
What GIS is, how geographic information systems work, the difference between spatial and attribute data, popular GIS software, and how industries use GIS mapping.