
Key takeaways
- Remote sensing measures energy reflected or emitted by the Earth's surface, without physical contact.
- Passive optical sensors need daylight and clear skies, whereas active radar works day and night and through cloud.
- Each surface has a spectral signature. Comparing bands, for example red and near-infrared, reveals what the eye cannot see.
- However, spatial, spectral, temporal and radiometric resolution always involve trade-offs. Therefore, choose the sensor for the question, not the sharpest image.
- Moreover, Landsat and Sentinel provide free, calibrated imagery that covers most monitoring needs.
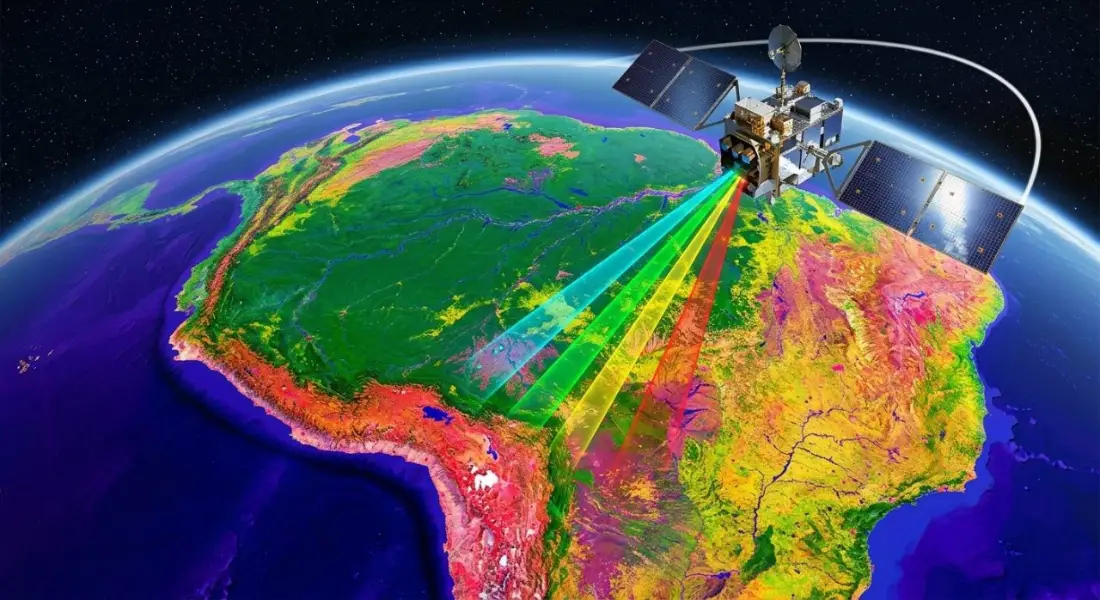
Every weather forecast, every flood map on the evening news and most modern crop monitoring systems depend on remote sensing. In fact, the term simply means gathering information about something without touching it. In Earth observation, for example, that something is the planet's surface and atmosphere, and the tools are sensors on satellites, aircraft and drones that record the energy coming from the ground.
This guide explains how remote sensing works, the types of sensors, what resolution really means, the missions that supply most of the world's free imagery, how raw images are turned into usable data, and the applications where it makes the biggest difference.
What is remote sensing?
To begin with, the Sun emits energy across the electromagnetic spectrum. When that energy reaches the Earth, surfaces absorb part of it, transmit part and reflect the rest. The surface also emits its own thermal energy. However, different materials do this in different ways at different wavelengths, which gives each one a characteristic pattern called a spectral signature.
- Healthy vegetation absorbs red and blue light for photosynthesis and strongly reflects near-infrared.
- Water absorbs most near-infrared and shortwave infrared, so it appears very dark in those bands.
- Bare soil reflects gradually more as wavelength increases, with the level depending on moisture and mineral content.
- Burned land has low near-infrared and high shortwave infrared reflectance.
- Built-up surfaces are bright across many bands and especially in shortwave infrared.
Then a remote sensing instrument measures the energy reaching it in several wavelength bands. By comparing those measurements, analysts can tell vegetation from water, healthy crops from stressed ones, and fresh burns from bare soil.
How remote sensing works
Passive sensors
Passive sensors record energy that comes naturally from the scene: reflected sunlight or emitted heat. For example, the multispectral instruments on Landsat and Sentinel-2 are passive. They produce images that are easy to interpret, but they need daylight for reflected bands, and they cannot see through cloud. As a result, in monsoon regions this can mean weeks without a clear image.
Active sensors
In contrast, active sensors send their own signal and measure what returns.
- Synthetic aperture radar (SAR), such as Sentinel-1, sends microwave pulses that pass through cloud and work at night. Radar responds to surface roughness, structure and moisture rather than colour. For example, calm water appears dark, which makes radar the main tool for flood mapping.
- LiDAR sends laser pulses and times their return to measure heights very precisely. It produces detailed elevation models, building heights and forest canopy structure.
Spectral bands: seeing beyond visible light
In addition to visible light, optical satellites record several parts of the spectrum. The table below shows the main Sentinel-2 bands and what they are commonly used for.
| Band | Wavelength (approx.) | Pixel size | Common use |
| B2 Blue | 490 nm | 10 m | True colour, water, atmosphere |
| B3 Green | 560 nm | 10 m | True colour, water indices |
| B4 Red | 665 nm | 10 m | Vegetation (chlorophyll absorption) |
| B5 to B7 Red edge | 705 to 783 nm | 20 m | Crop condition, nitrogen status |
| B8 Near-infrared | 842 nm | 10 m | Vegetation vigour, NDVI |
| B11 SWIR 1 | 1610 nm | 20 m | Moisture, built-up areas, MNDWI |
| B12 SWIR 2 | 2190 nm | 20 m | Burn severity (NBR), geology |
Combining bands creates false-colour images and indices. Showing near-infrared as red, for example, makes healthy vegetation appear bright red. Indices such as NDVI for vegetation, MNDWI for water and NBR for burned areas turn these differences into numbers that can be mapped and compared over time.
The four kinds of resolution
| Resolution | Meaning | Example |
| Spatial | Ground size of one pixel | Sentinel-2: 10 m; Landsat: 30 m; commercial: 30 to 50 cm |
| Spectral | Number and width of bands | Sentinel-2: 13 bands; hyperspectral sensors: hundreds |
| Temporal | How often the same place is imaged | Sentinel-2: about 5 days; MODIS: daily |
| Radiometric | How finely brightness is recorded | Landsat 9: 14-bit; older Landsat: 8-bit |
There is always a trade-off. However, sensors with very fine pixels usually cover smaller areas, revisit less often and cost more. For most regional monitoring, 10 to 30 m imagery with frequent revisits is more useful than occasional 50 cm images.
The satellites doing the work
Landsat
Operated by NASA and the U.S. Geological Survey, Landsat has imaged the Earth continuously since 1972. Landsat 8 and Landsat 9 now work together to provide 30 m multispectral imagery every 8 days, plus a 15 m panchromatic band and thermal bands. Also, the archive is free and consistently processed, which makes Landsat unmatched for change analysis over decades.
Sentinel
The European Union's Copernicus programme operates the Sentinel family, all with free and open data.
- Sentinel-1: C-band radar for floods, ground movement, sea ice and crops, in any weather.
- Sentinel-2: 13-band optical imagery at 10 to 60 m, with a revisit of about five days.
- Sentinel-3: ocean colour, land and sea surface temperature at coarser resolution.
- Sentinel-5P: atmospheric gases such as nitrogen dioxide and methane.
MODIS and VIIRS
In contrast, these sensors image the whole planet daily at 250 m to 1 km. Generally, analysts use them for vegetation anomalies, fire detection, snow cover and night-time lights.
Commercial satellites
Commercial constellations from companies such as Maxar, Airbus and Planet provide imagery down to about 30 cm, or daily coverage at 3 to 5 m. Consequently, they are the right choice for mapping individual buildings, small infrastructure and rapid change at site level.
From raw image to analysis-ready data
A satellite image straight from the sensor is a grid of numbers that still contains distortions. Before analysis, imagery goes through several steps, most of which the data providers now do for you.
- Radiometric calibration converts raw digital numbers into physical units of radiance or reflectance.
- Atmospheric correction removes the effect of haze and gases to give surface reflectance. Fortunately, the agencies already correct Sentinel-2 Level-2A and Landsat Collection 2 Level-2 products.
- Geometric correction aligns the image with a map coordinate system and corrects for terrain.
- Cloud and shadow masking removes contaminated pixels.
- Compositing combines several images, for example a monthly median, to fill gaps.
Working from analysis-ready products saves time and, more importantly, makes results from different dates comparable.
Remote sensing applications
Disaster response
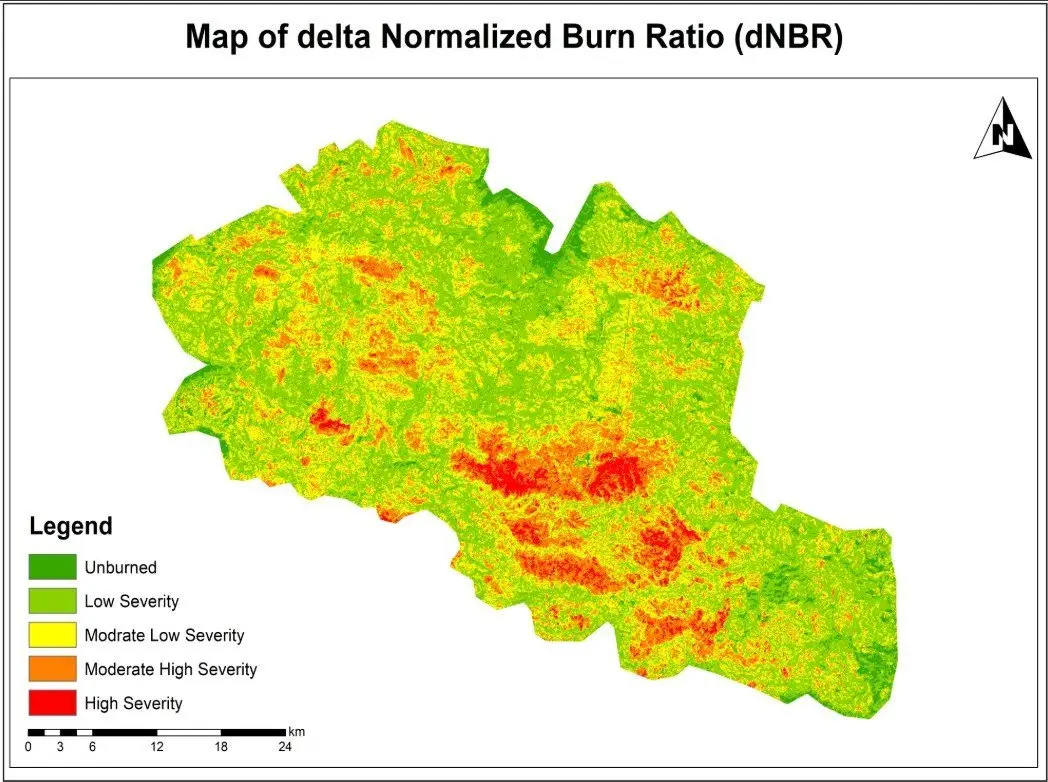
Before-and-after imagery maps floods, landslides, earthquake damage and wildfire extent within hours or days. Our wildfire burn severity assessment used Sentinel-2 imagery with NBR and dNBR to classify damage from unburned to high severity.
Agriculture and food security
For example, vegetation indices track crop growth through the season, flag stress early and support yield estimates over whole regions. Our vegetation condition time series in Google Earth Engine is an example.
Climate and environment
Long satellite records measure changes in forests, glaciers, snow, coastlines, surface temperature and water bodies, and provide consistent indicators for national and international reporting.
Water resources
Imagery tracks reservoir levels, irrigation, wetlands and river course changes, and radar maps floods through cloud.
Urban planning and infrastructure
Similarly, imagery shows where cities are growing, maps impervious surfaces and urban heat, and provides current base maps for planning and asset management.
Forestry and conservation
Optical and radar data detect deforestation and degradation, and LiDAR measures canopy height and biomass.
Limitations to keep in mind
- To begin with, cloud, smoke and darkness block optical imagery.
- Pixels larger than the features of interest produce mixed signals.
- Also, derived maps are models and contain errors, so you need to validate them.
- Similarly, you still need ground data for training classifiers and checking results.
Remote sensing is at its best when it is paired with good ground knowledge and a clear question. If you need imagery analysis for monitoring, mapping or reporting, our remote sensing and Earth observation team can help you choose the right data and methods.
Frequently asked questions
What is the difference between remote sensing and GIS?
In short, remote sensing is the way you collect data: sensors on satellites, aircraft or drones measuring the surface from a distance. GIS, on the other hand, is the system that stores, analyses and maps spatial data. In practice they work together: remote sensing provides imagery and derived layers such as land cover or flood extent, and GIS combines them with roads, boundaries, population and other data to answer a question.
How accurate is satellite imagery?
It depends on what you mean by accurate. Positional accuracy for Sentinel-2 and Landsat is typically within about one pixel or better, so roughly 10 m and 30 m respectively. For example, commercial imagery can be accurate to a few metres. The accuracy of products derived from imagery, such as a land-cover map, depends on the method and should always be measured against reference data and reported.
Can anyone access satellite imagery?
Yes. Landsat imagery is free from the USGS, and Sentinel imagery is free from the Copernicus Data Space Ecosystem. Both are also available in Google Earth Engine and Microsoft's Planetary Computer. Very high-resolution commercial imagery from providers such as Maxar, Airbus and Planet is paid, though some programmes offer it for research and humanitarian use.
Is remote sensing only done by satellites?
No. Aircraft carry high-resolution cameras, LiDAR and hyperspectral sensors for detailed surveys. Meanwhile, surveyors widely use drones for site-scale mapping, crop scouting and construction monitoring. Ground-based instruments, such as spectroradiometers and terrestrial laser scanners, are also forms of remote sensing.
What resolution do I need?
Choose the coarsest resolution that still shows the features you care about, because finer imagery costs more, covers less and is harder to process. For instance, regional crop or drought monitoring works well at 10 to 30 m. However, mapping individual buildings or trees needs 1 m or better. Finally, daily monitoring of large areas may favour 250 m MODIS or 300 m Sentinel-3.
Related articles
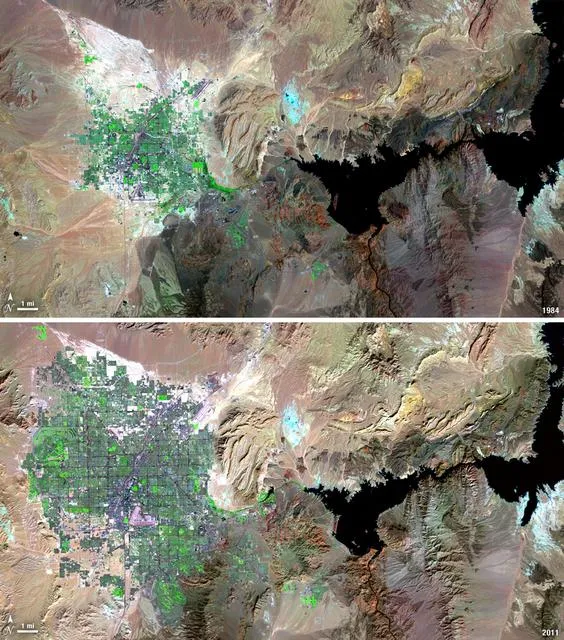
Satellite Change Detection: Methods, Accuracy and Real-World Applications
How satellite change detection works, which methods to use, where errors come from, and how indices such as NBR and dNBR turn imagery into measurable change.
NDVI Explained: How Satellite Vegetation Indices Monitor Crops, Forests and Fire Recovery
What NDVI measures, how it is calculated from Sentinel-2 and Landsat bands, how to interpret values, and how vegetation indices support agriculture and post-fire monitoring.