About this project
Project overview
Example workflow showing how Spatial Nexus approaches this type of analysis.
A reproducible script tracking seasonal vegetation index trends across several years.
This page shows a typical Spatial Nexus workflow for this type of analysis.
- NDVI time series
- Google Earth Engine vegetation monitoring
- crop monitoring remote sensing
- seasonal vegetation analysis
- Earth Engine scripting
Project at a glance
- Sector
- Remote Sensing
- Service
- Google Earth Engine
- Software
- Google Earth Engine, Python, R
THE CHALLENGE
What needed solving
- Single images cannot show seasonal or long-term vegetation trends.
- Processing years of imagery locally is slow.
OBJECTIVES
What the project set out to do
- Build a reproducible Earth Engine script.
- Track seasonal NDVI over several years.
Methodology
Our workflow, step by step
01
Collection
Filter imagery by area, date and cloud cover.
02
Index
Calculate NDVI per image.
03
Compositing
Build seasonal composites.
04
Trend
Chart and map trends per zone.
Visual output
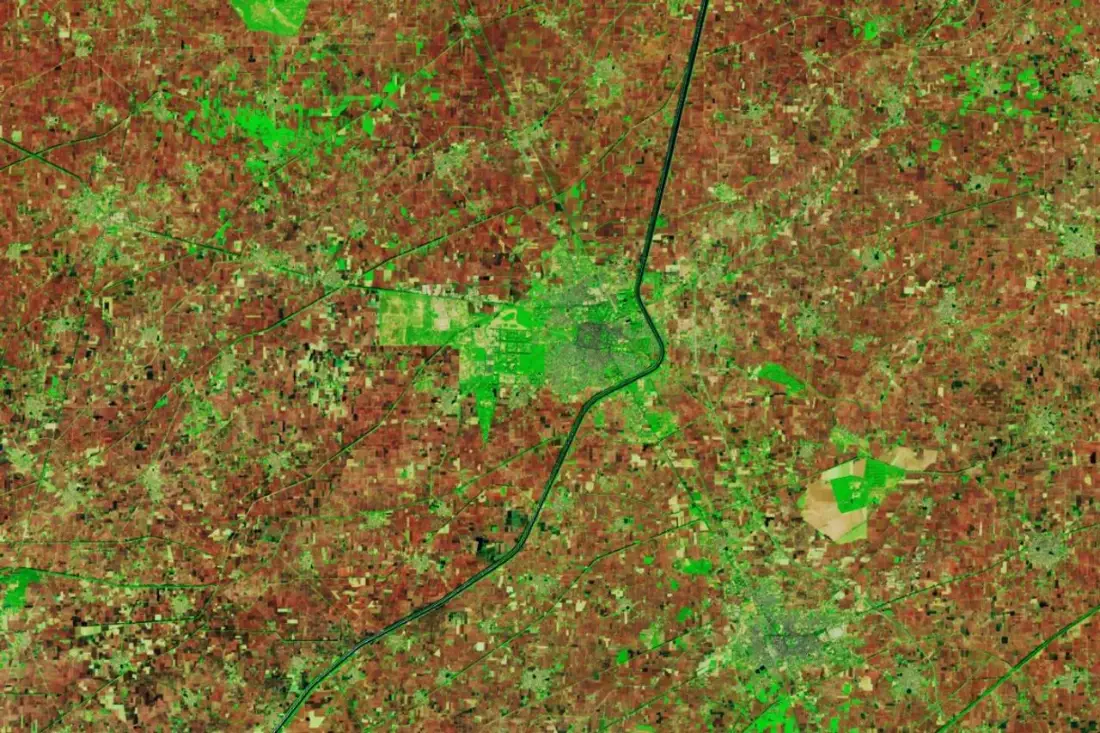
The map
Select the image to view it at full size.
Results
What the analysis delivered
- Seasonal NDVI composites and trend charts.
- A script that updates as new imagery arrives.
Key highlights
Why this project stands out
- Collection
- Index
- Compositing
- Trend
Data sources
Data used
- Sentinel-2 and Landsat archives
- Area of interest boundary
Tools and technologies
Software and methods
Google Earth Engine
Python
R
Deliverables
What the client received
- Documented Earth Engine scripts
- Exported rasters and charts
- Earth Engine app where useful
- Method note
FAQ
Questions about this project
Why Google Earth Engine?
It hosts petabytes of satellite data and processes long time series in the cloud.
Can results be exported?
Yes. Rasters and charts can be exported for reports and GIS.
Related projects