
Key takeaways
- Geospatial intelligence combines satellite observation, GIS data and spatial analysis into evidence planners can act on.
- Its biggest contribution is consistency: the same method applied to every district, every year.
- In addition, free satellite archives make long-term environmental baselines possible almost anywhere.
- For infrastructure, GIS links terrain, hazards, demand and existing assets so planners can compare options fairly.
- Many SDG indicators, such as land consumption, forest area and water-related ecosystems, are measured directly with geospatial data.
Planners increasingly make decisions under pressure: faster urban growth, more extreme rainfall and heat, shrinking groundwater and tighter budgets. Consequently, decisions based on outdated maps or a few site visits carry real risk. Geospatial intelligence gives planners a current, consistent and measurable picture of land, water, people and infrastructure, and lets them test options before committing to them.
This article looks at how GIS and remote sensing support environmental and infrastructure planning in practice, area by area, with the methods behind each and the lessons we have learned applying them.
Understanding GIS and remote sensing together
Remote sensing supplies observations: satellites such as Landsat and Sentinel-2 image every part of the planet every few days, and radar satellites see through cloud. GIS supplies context and analysis: boundaries, roads, land records, population, utilities and the tools to combine them. On its own, a satellite image shows that vegetation has declined; combined with GIS, it shows which villages, which watershed and how many hectares, and how that compares with last year.
However, the real strength of the combination is consistency. As a result, planners can apply the same method to every district, every season and every year, which gives planners comparable numbers rather than one-off studies.
Environmental monitoring and policy
Climate change monitoring
Long satellite records track land surface temperature, vegetation condition, snow and glacier extent, and coastline change. Combined with climate reanalysis data such as ERA5, they show where conditions are shifting fastest. Urban heat mapping from Landsat thermal bands, for example, identifies neighbourhoods that run several degrees hotter than their surroundings, which helps target tree planting and cool-roof programmes.

Forest and biodiversity conservation
For example, satellite imagery maps forest cover, detects clearing and degradation, and measures habitat fragmentation. Global datasets such as the Hansen Global Forest Change maps give a starting point, but management decisions usually also need local mapping with Sentinel-2 and field checks. Landscape metrics, such as patch size and connectivity, help identify corridors worth protecting.
Water resource management
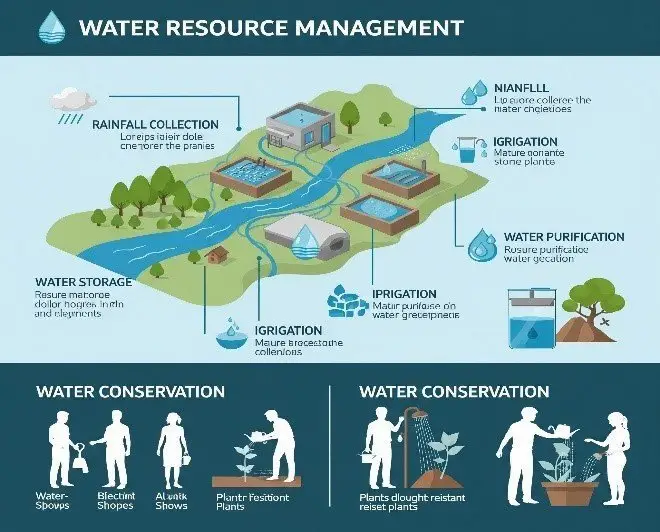
GIS delineates watersheds and drainage networks from elevation models, while imagery tracks reservoirs, wetlands, river migration and irrigated area. Together they support water allocation, flood management and drought planning. In irrigated regions, satellite estimates of evapotranspiration help show where water is actually being used, compared with where it is allocated.
Pollution monitoring and control
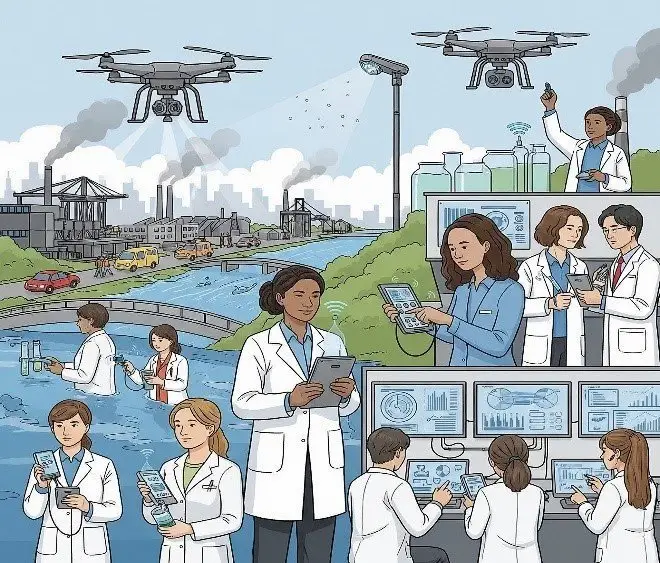
Spatial analysis links measurements, such as air quality stations, water samples and Sentinel-5P nitrogen dioxide data, to land use, industry, traffic and population. Moreover, interpolation and hot spot analysis reveal where pollution concentrates and which communities are most exposed, which is the basis for targeted regulation.
Development planning and urban growth
Urban and regional planning
Planners need to know where the city is growing, where people live and work, and where services fall short. For example, satellite time series map built-up expansion year by year. Population grids, employment data and travel-time analysis show which areas are underserved. Our employment density analysis of Dübendorf is an example of turning economic data into a planning layer.

Disaster management and risk reduction
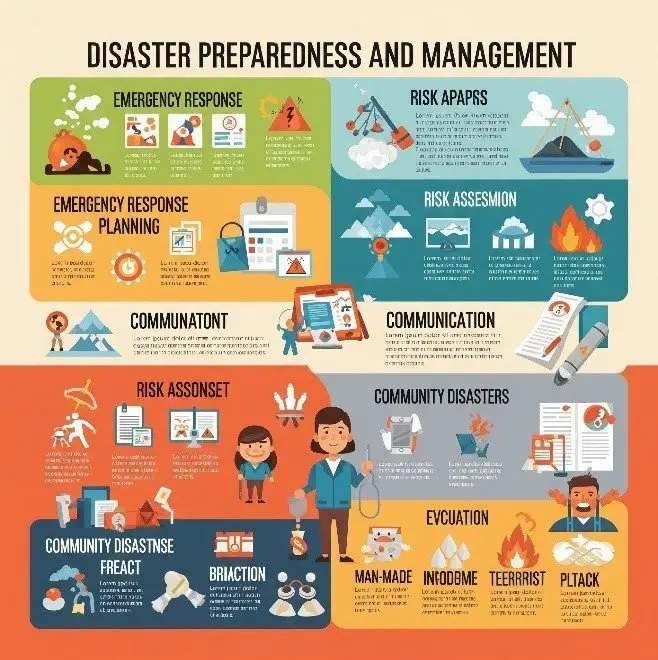
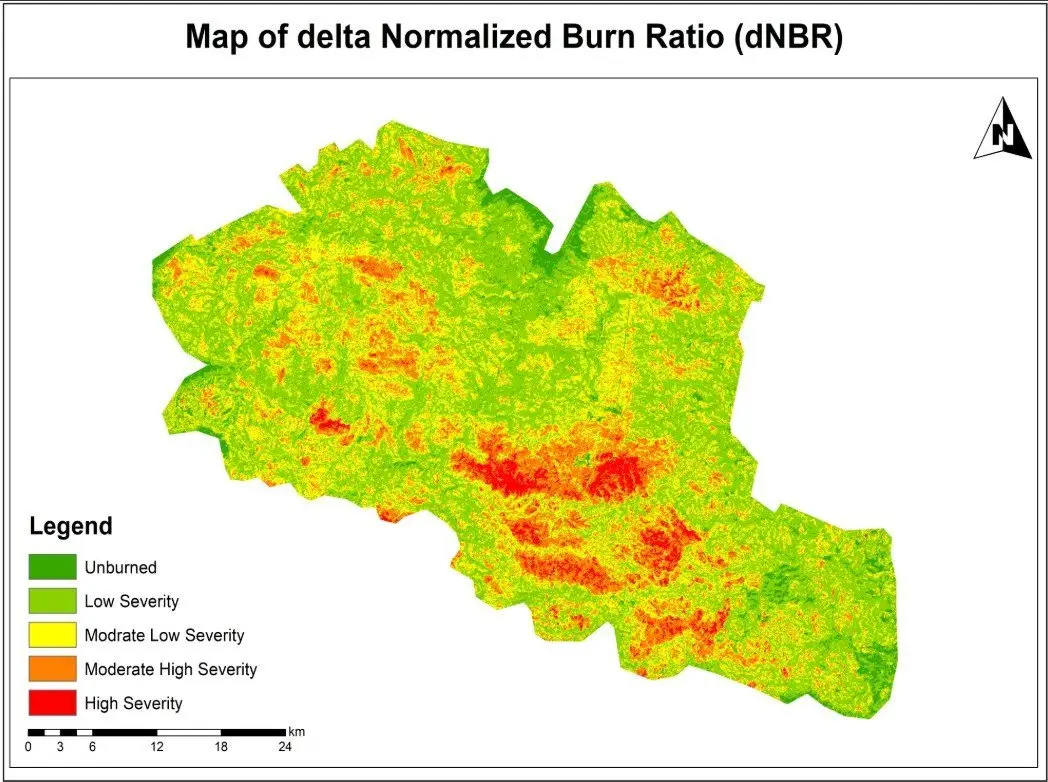
Before an event, hazard maps identify areas exposed to floods, landslides, heat and wildfire, and exposure analysis counts the people, buildings and assets in harm's way. After an event, imagery maps damage quickly so agencies can target relief. Our wildfire burn severity assessment used Sentinel-2, NBR and dNBR, and our flood susceptibility mapping shows the planning side of the same work.
Agricultural optimisation
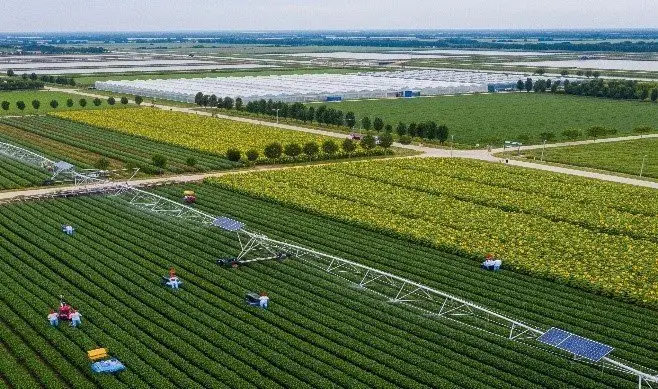
Vegetation indices track crop condition through the season, soil and climate layers define suitability, and irrigation mapping shows where water goes. Used together, they also help agencies target extension services and help farmers apply water and fertiliser where they make the most difference.
Infrastructure and smart development
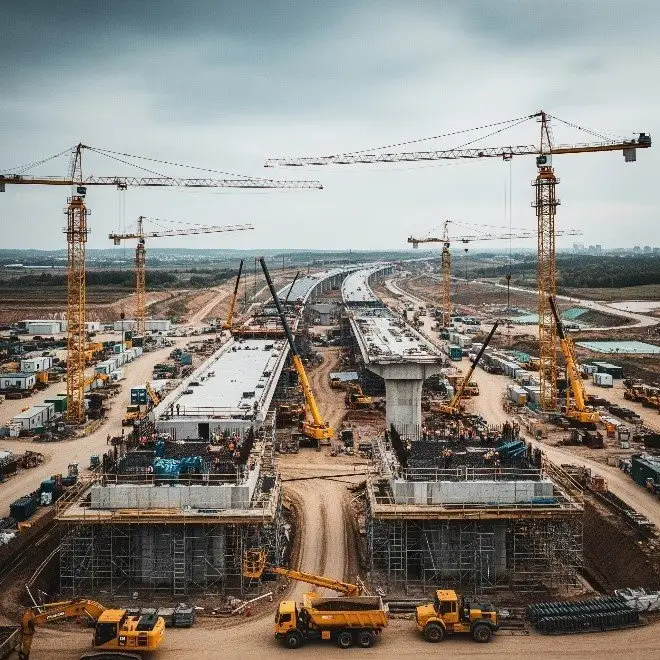
For roads, pipelines, power lines and transit, GIS compares alternatives on terrain, land use, environmental constraints, hazards and demand, so the trade-offs are explicit. Elevation models support earthwork and drainage design, and asset databases keep track of what crews have built. Our bike route network analysis used ArcGIS Pro and OpenStreetMap to plan terrain-aware cycling routes, and our CAD-to-GIS asset layer project brought engineering drawings into a shared map.
Supporting the Sustainable Development Goals
In fact, agencies measure several SDG indicators directly with geospatial data, which makes GIS and remote sensing central to national reporting.
| Goal | Indicator | Geospatial contribution |
| SDG 6: Clean water | 6.6.1 Change in extent of water-related ecosystems | Satellite mapping of surface water and wetlands over time |
| SDG 11: Sustainable cities | 11.3.1 Ratio of land consumption to population growth | Built-up area from imagery compared with population data |
| SDG 11 | 11.7.1 Share of built-up area that is open public space | Mapping parks and public spaces in GIS |
| SDG 13: Climate action | Disaster risk and adaptation indicators | Hazard, exposure and damage mapping |
| SDG 15: Life on land | 15.1.1 Forest area as a proportion of total land | Forest cover mapping and change detection |
| SDG 15 | 15.3.1 Proportion of land that is degraded | Land cover, productivity and soil carbon trends |
What makes geospatial planning work
Across many projects, a few things consistently separate useful geospatial work from attractive maps that change nothing:
- A clear decision. Above all, start from what the planner needs to decide, and work back to the data.
- A baseline. After all, you can only measure change against a reliable starting point. Build it early and document it.
- Validation. Also, every derived map should come with an accuracy figure and a note of its limits.
- Local knowledge. Field staff and communities catch errors that no dataset reveals.
- Shared data. One maintained spatial database is worth more than many project-by-project copies.
- Repeatability. Finally, scripted workflows mean next year's analysis takes days, not months.
Challenges and opportunities
However, the barriers are often organisational: data scattered across departments, inconsistent standards, short project cycles and limited technical staff. At the same time, the opportunities have never been better. Free satellite archives, cloud platforms such as Google Earth Engine, open data such as OpenStreetMap and steadily improving GeoAI methods mean that a small, well-organised team can now produce evidence that once required a national agency.
If you are planning environmental monitoring, infrastructure or regional development and want geospatial evidence behind it, our environment and climate and infrastructure and engineering GIS teams can help design the data and analysis around your decisions.
Frequently asked questions
What is geospatial intelligence?
Geospatial intelligence is information about the Earth's surface and human activity that analysts have processed to support a decision. It combines data from satellites, aircraft, drones, surveys and databases with GIS analysis. The term began in defence and security, but it is now widely used for environmental management, planning, infrastructure and business.
How does remote sensing help environmental planning?
Specifically, it provides repeated, consistent observations over large areas, often going back decades. That makes it possible to build a baseline for forest cover, water bodies, urban area or vegetation condition, measure how they change, and check whether policies are working. It is especially valuable where field monitoring is sparse or areas are hard to reach.
Can GIS support infrastructure projects?
Yes, at every stage. During planning, GIS compares route or site options using terrain, land use, hazards and demand. Then, at the design stage, it supplies elevation, drainage and existing utility data. During construction and operation, it tracks assets, inspections and maintenance, and links CAD drawings to a shared map.
Which data sources are most useful for environmental planning?
Sentinel-2 and Landsat for land and vegetation, Sentinel-1 radar for floods and areas with persistent cloud, Copernicus or SRTM elevation models for terrain and drainage, climate datasets such as ERA5 and CHIRPS, population grids such as WorldPop, and national datasets for boundaries, roads, protected areas and land records.
What are the main barriers to using geospatial data in government?
The most common are scattered and inconsistent data, unclear ownership, limited technical staff and systems that do not talk to each other. These are organisational problems as much as technical ones. Agreeing standards, setting up a shared spatial database and training staff usually deliver more value than buying new software.
Related articles
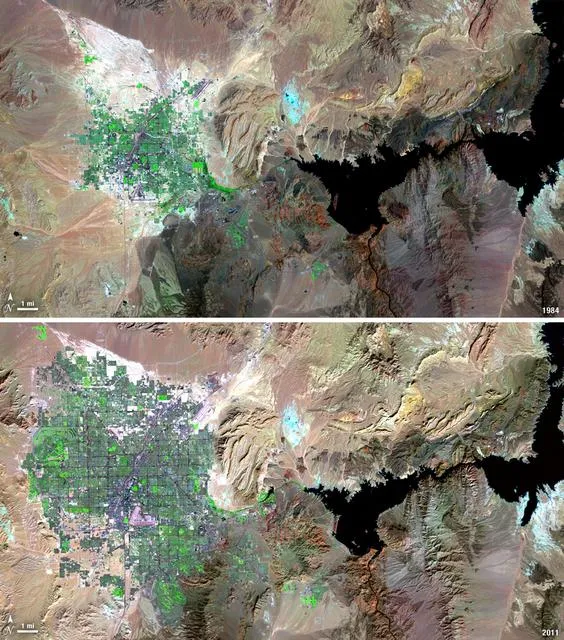
Satellite Change Detection: Methods, Accuracy and Real-World Applications
How satellite change detection works, which methods to use, where errors come from, and how indices such as NBR and dNBR turn imagery into measurable change.
How to Choose the Right Coordinate Reference System (CRS) for GIS Projects
A practical guide to coordinate reference systems, map projections, UTM and WGS 84, and how the right CRS keeps distance, area and network analysis accurate.
NDVI Explained: How Satellite Vegetation Indices Monitor Crops, Forests and Fire Recovery
What NDVI measures, how it is calculated from Sentinel-2 and Landsat bands, how to interpret values, and how vegetation indices support agriculture and post-fire monitoring.