Replicate & Enhance U.S. National Park Service Map Using ArcGIS Pro

Replicate & Enhance U.S. National Park Service Map Using ArcGIS Pro

Replicate & Enhance U.S. National Park Service Map Using ArcGIS Pro

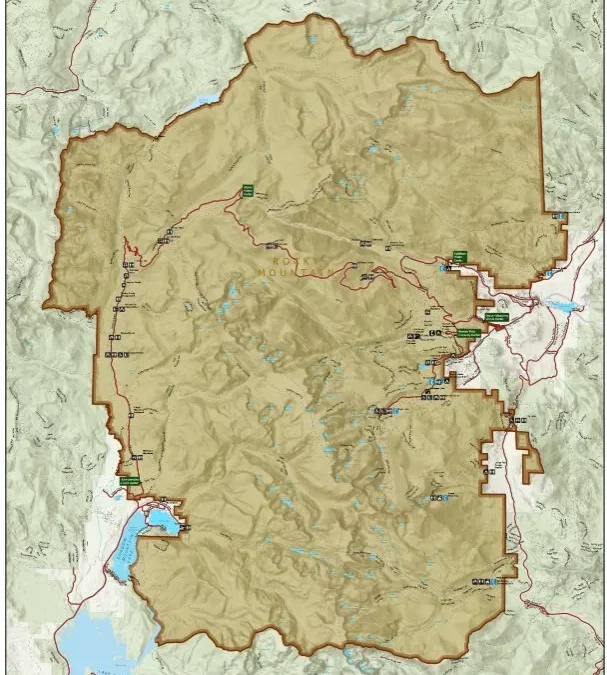
Replicating and enhancing a U.S. National Park Service map in ArcGIS Pro to improve readability, visual hierarchy and usability for visitors and planners.

About this project

Project overview

High-quality cartographic design is essential for effective communication in environmental management and tourism. In this project, Spatial Nexus replicated and enhanced maps developed by the National Park Service (NPS) using ArcGIS Pro to create a more refined, user-centric mapping solution.

The objective was to improve map readability, visual hierarchy, and spatial clarity while ensuring consistency with modern GIS cartographic standards. The enhanced maps were designed to better support park visitors, planners, and decision-makers by delivering clear and intuitive geographic insights.

  • GIS cartography
  • ArcGIS Pro map design
  • national park mapping
  • map symbology
  • digital cartography

Project at a glance

Client
Environmental management and tourism
Sector
Parks and Recreation
Location
United States
Software
ArcGIS Pro, GIS Data Sources, Digital Cartography Techniques

THE CHALLENGE

What needed solving

  • The original map needed clearer hierarchy between terrain, trails and facilities.
  • Dense information reduced readability for visitors.
  • The enhanced version had to follow modern cartographic standards while staying faithful to the original.

OBJECTIVES

What the project set out to do

  • Replicate the original NPS map accurately in ArcGIS Pro.
  • Improve readability, symbology and visual hierarchy.
  • Make the map more intuitive for visitors, planners and decision-makers.

Methodology

Our workflow, step by step

01

Data assembly

Terrain, trail and infrastructure layers were collected and prepared in ArcGIS Pro.

02

Replication

The original layout, extent and content were reproduced as the baseline.

03

Symbology optimisation

Colours, line weights and symbols were refined to separate features clearly.

04

Labelling and hierarchy

Label placement and typography were improved so key information stands out.

05

Layout finishing

Legend, scale, north arrow and inset elements were redesigned for clarity.

Visual output

The map

Select the image to view it at full size.
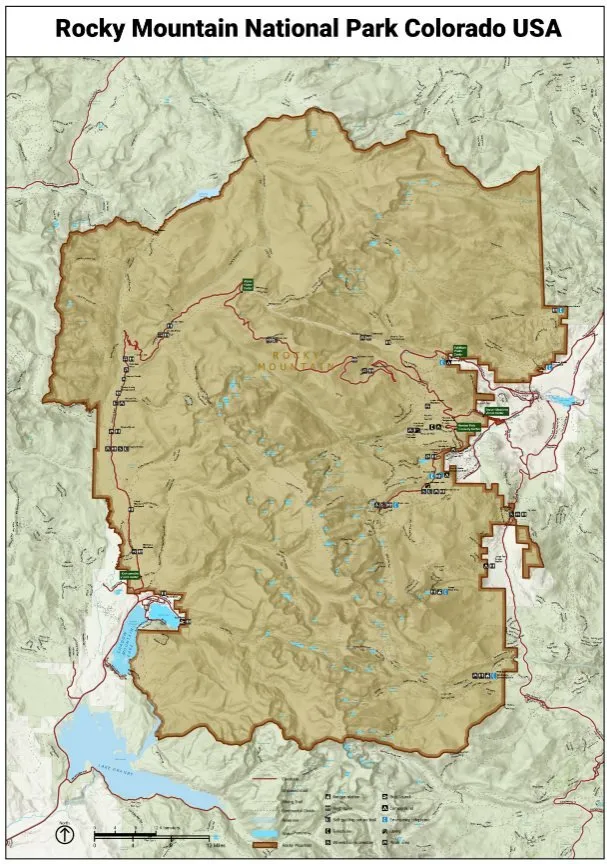
Replicate & Enhance U.S. National Park Service Map Using ArcGIS Pro, map output

Results

What the analysis delivered

  • A cleaner, more readable park map with stronger visual hierarchy.
  • Improved wayfinding for visitors through clearer trails and facilities.
  • A professional cartographic product suitable for print and digital use.

Key highlights

Why this project stands out

  • Faithful replication of an official map
  • Refined symbology and labelling
  • Improved visual hierarchy
  • Print and digital ready

Data sources

Data used

  • Terrain and elevation data
  • Trail networks
  • Park infrastructure and facilities
  • Boundaries and reference layers

Tools and technologies

Software and methods

ArcGIS ProCartographic design and spatial data processing
GIS Data SourcesTerrain, trails, and park infrastructure datasets
Digital Cartography TechniquesVisualization and layout optimization

Deliverables

What the client received

  • Enhanced park map (high resolution)
  • ArcGIS Pro project and layout
  • Symbology documentation

WHY IT MATTERS

Good cartography makes geographic information usable. Clearer park maps improve visitor experience and support planning and management.

FAQ

Questions about this project

Why replicate an existing map?

Replication establishes an accurate baseline, so enhancements can be measured against the original design.

What was improved?

Symbology, label placement, colour hierarchy and layout elements, focusing on readability and usability.

Which software was used?

ArcGIS Pro for cartographic design and spatial data processing.

Planning a similar geospatial project?

GIS Data Visualization Specialist for Choropleth Map Series Using ArcGIS 10.8

GIS Data Visualization Specialist for Choropleth Map Series Using ArcGIS 10.8

GIS Data Visualization Specialist for Choropleth Map Series Using ArcGIS 10.8

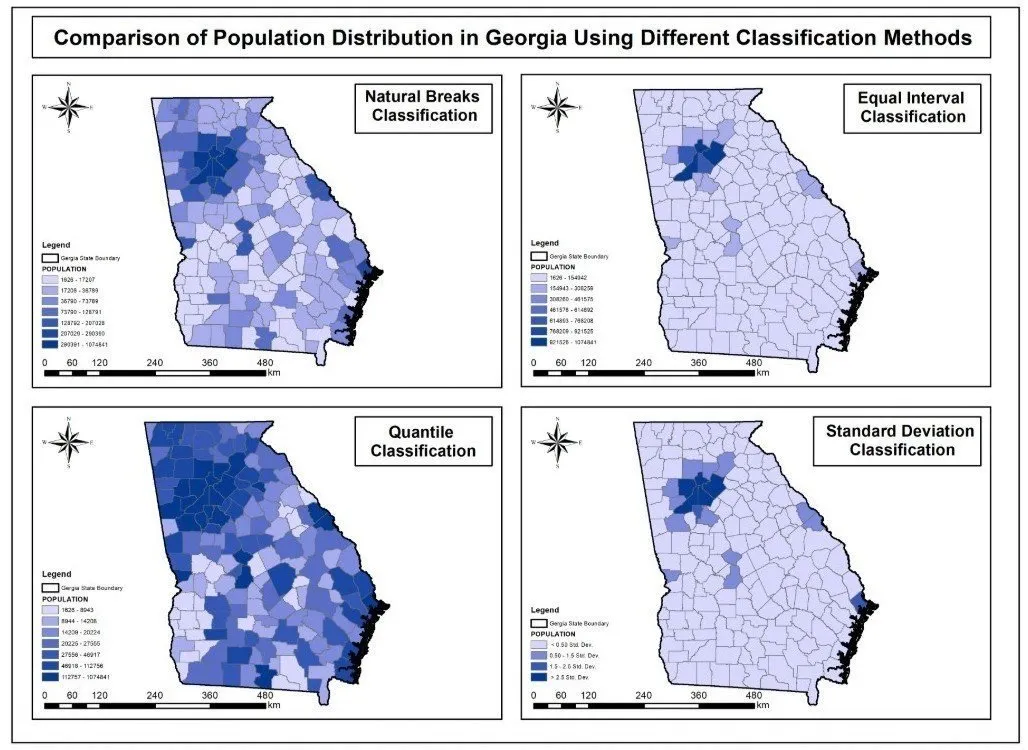
A comparative choropleth map series of population across all 159 Georgia counties, showing how four classification methods change the interpretation of the same census data.

About this project

Project overview

Data visualization plays a critical role in transforming raw demographic data into meaningful spatial insights. In this project, Spatial Nexus delivered a comprehensive choropleth mapping solution using population data from the U.S. Census Bureau, focusing on all 159 counties in Georgia.

As a GIS Analyst, the objective was to design a comparative choropleth map series that highlights how different classification methods influence the interpretation of spatial patterns. Using ArcGIS 10.8, four distinct maps were created to ensure analytical depth and visual consistency.

  • choropleth map
  • GIS data visualization
  • ArcGIS classification methods
  • natural breaks Jenks
  • census population mapping

Project at a glance

Client
Research and data visualisation
Sector
Demographics
Location
Georgia, USA (159 counties)
Software
ArcGIS 10.8, Population Data, GIS Classification Techniques

THE CHALLENGE

What needed solving

  • The same population data can tell very different stories depending on how it is classified.
  • Non-specialists rarely see how classification choices influence a map.
  • Four maps needed identical styling so differences came only from the method.

OBJECTIVES

What the project set out to do

  • Map population for all 159 counties in Georgia, USA.
  • Compare Equal Interval, Quantile, Natural Breaks (Jenks) and Standard Deviation classification.
  • Keep consistent cartographic design across the series.
  • Deliver a clean, professional PDF map series.

Methodology

Our workflow, step by step

01

Data preparation

Census population figures were joined to county boundaries and checked for completeness.

02

Classification

Four maps were produced using Equal Interval, Quantile, Natural Breaks (Jenks) and Standard Deviation methods.

03

Consistent styling

A shared colour scheme, legend design and layout ensured a fair visual comparison.

04

Layout and export

The four maps were arranged in a single comparative series and exported as a high-quality PDF.

Visual output

The map

Select the image to view it at full size.

GIS Data Visualization Specialist for Choropleth Map Series Using ArcGIS 10.8, map output

Results

What the analysis delivered

  • A side-by-side series that shows clearly how classification shapes interpretation.
  • Natural Breaks and Quantile maps highlight different patterns from the same data.
  • A reusable reference for teaching and reporting on thematic mapping.

Key highlights

Why this project stands out

  • Four classification methods compared
  • All 159 Georgia counties
  • Consistent professional styling
  • High-quality PDF deliverable

Data sources

Data used

  • U.S. Census Bureau population data
  • Georgia county boundaries (159 counties)

Tools and technologies

Software and methods

ArcGIS 10.8Spatial analysis and map production
Population DataU.S. Census Bureau
GIS Classification TechniquesStatistical data grouping and visualization

Deliverables

What the client received

  • Comparative choropleth map series (PDF)
  • Prepared GIS dataset
  • Classification notes

WHY IT MATTERS

Choosing the right classification method prevents misleading maps. This series makes those choices transparent for analysts, students and decision-makers.

FAQ

Questions about this project

What is a choropleth map?

A thematic map that shades areas such as counties according to a data value, for example population.

Which classification method is best?

It depends on the data distribution and purpose. Natural Breaks suits clustered data, Quantile gives equal counts per class, and Equal Interval is easiest to read.

Which software was used?

ArcGIS 10.8 for analysis, classification and map production.

Planning a similar geospatial project?