
Key takeaways
- Most "change" in a careless analysis is not change at all. It is season, cloud, haze or misalignment between images.
- Choose dates from the same season and, where possible, the same sensor, and work from surface reflectance.
- Index differencing (NDVI, NDWI, dNBR) is fast and transparent; post-classification comparison tells you what changed into what.
- Time-series methods such as LandTrendr and CCDC separate gradual trends from sudden events and are now practical in Google Earth Engine.
- Report change as an area with a confidence interval, based on an independent accuracy sample, not as a raw pixel count.
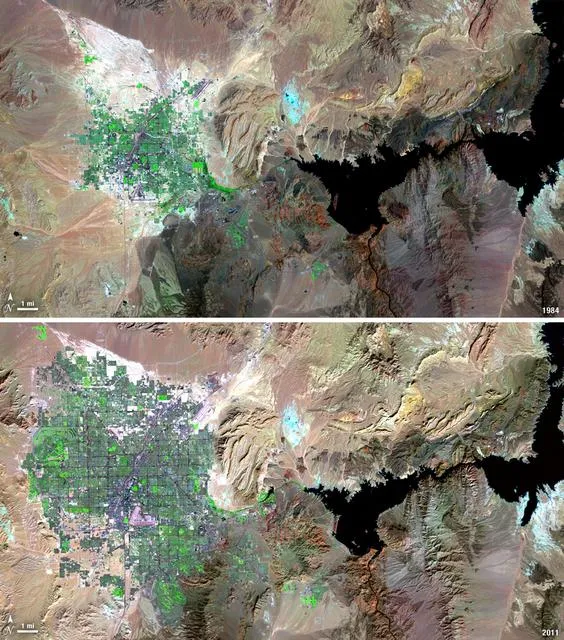
Change detection is one of the most requested analyses in remote sensing, because the question behind it is simple: what is different now, and where? A ministry wants to know how much farmland housing has replaced. An insurer wants to see which fields flooded. A conservation project needs to prove that forest cover inside a reserve has held steady. In each case the answer comes from comparing images of the same place taken at different times.
The comparison itself is easy. Making sure the differences you find are real is where the work is. This guide explains how we choose imagery, the main methods and when each one fits, a worked wildfire example, the usual sources of error, and how to report results so they stand up to scrutiny.
What change detection actually measures
Every pixel in a satellite image records how much light the surface reflected in each band. If the surface changes, for example when someone clears a forest or a field floods, its spectral signature changes too. Change detection looks for pixels whose signature has shifted more than you would expect from normal variation.
The difficulty is that many things alter pixel values without any real change on the ground: the sun angle, haze, a slightly different sensor, soil moisture after rain, or simply the season. Therefore, a good analysis removes as much of that noise as possible before looking for change.
Choosing the right images
Most problems in change detection start with the image pair. Before any processing, we check four things.
- Season. Compare April with April, not April with October. Otherwise crops, deciduous trees and grassland will all appear to have changed.
- Sensor. Use the same sensor family where possible. If you must mix Landsat and Sentinel-2, use a harmonised product such as NASA's HLS.
- Processing level. Work from surface reflectance (Sentinel-2 Level-2A, Landsat Collection 2 Level-2) so that the same atmospheric correction applies on both dates.
- Cloud and shadow. Mask them on both dates. An unmasked cloud on the first date and clear sky on the second will look exactly like new bare ground.
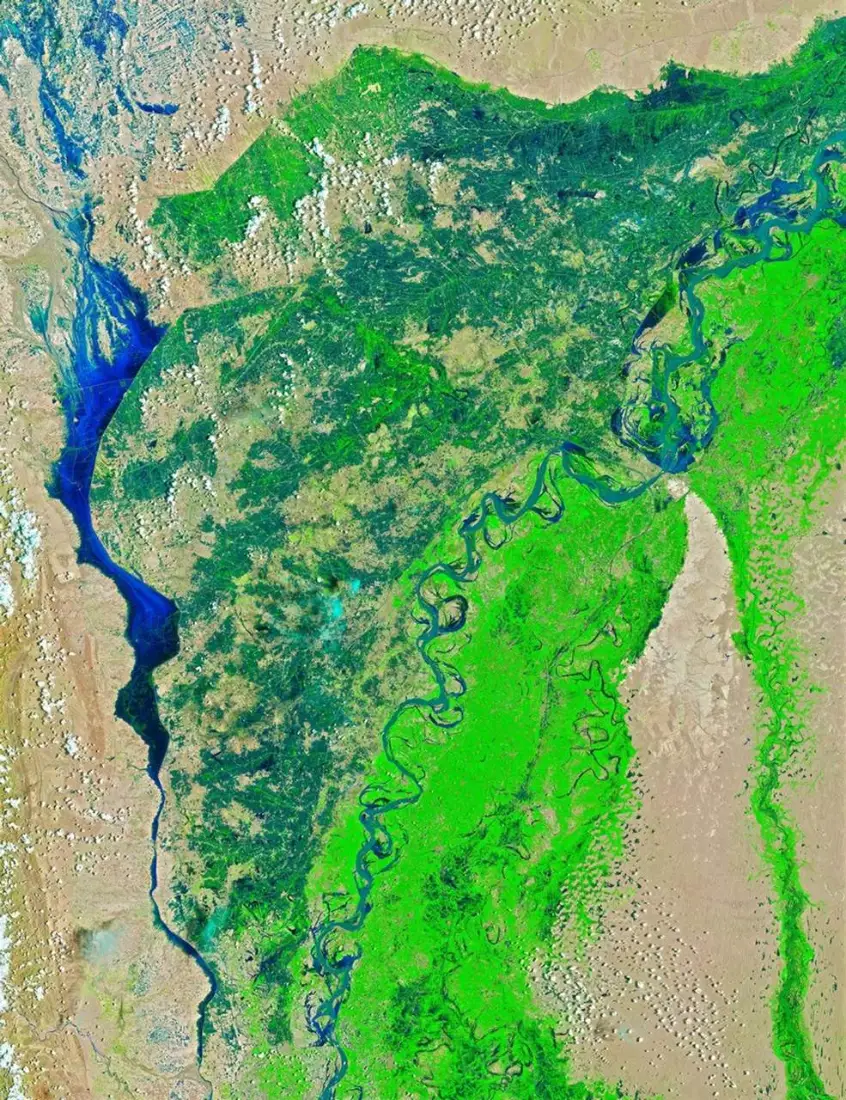
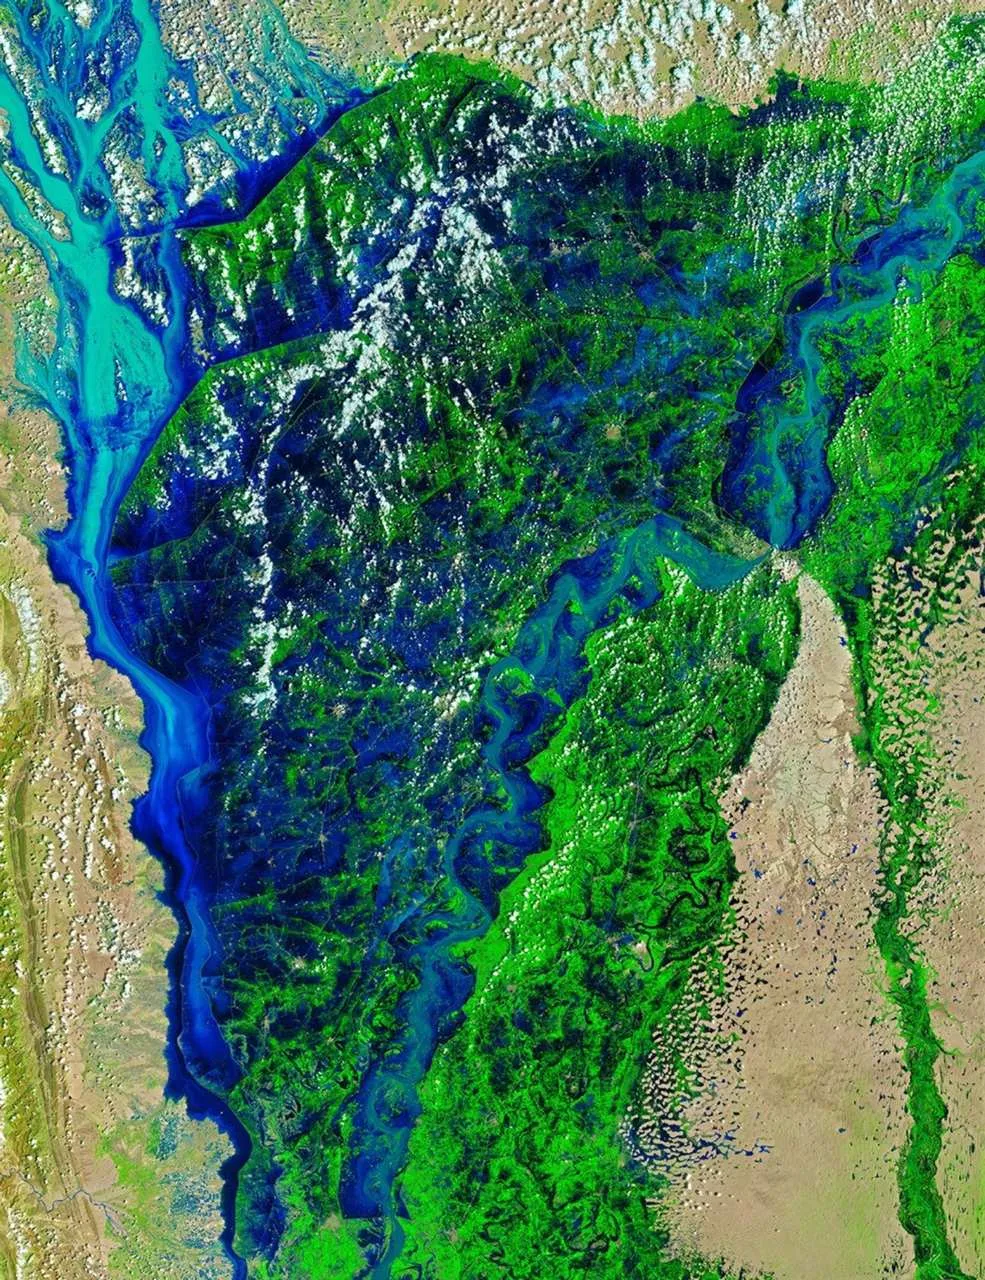
For events such as floods or fires, the "before" image should be as close to the event as possible while still being clear, and the "after" image should come once the event has peaked but before recovery or cleanup has started.
The main change detection methods
Image and index differencing
Calculate a spectral index on both dates and subtract one from the other. The analyst then flags pixels where the difference passes a threshold as changed. The choice of index follows the type of change:
| Change of interest | Index | Why it works |
| Vegetation loss or gain | NDVI | Responds to green leaf cover |
| Surface water, floods | NDWI or MNDWI | Water absorbs NIR and SWIR strongly |
| Burned area and severity | NBR, giving dNBR | SWIR rises sharply over char and ash |
| New built-up land | NDBI, plus SWIR bands | Roofs and paving reflect SWIR |
Differencing is fast, easy to explain and easy to repeat. Its weakness is the threshold: set it too low and you get false alarms, too high and you miss real change. We set thresholds by sampling known changed and unchanged areas rather than by eye.
Post-classification comparison
Classify each date independently into land-cover classes, then overlay the two maps. The output is a from–to matrix, for example 1,240 hectares of cropland converted to built-up land. This is the standard approach for land use and land cover change studies because the result is immediately meaningful to planners.
The catch is that errors multiply. If each classification is 88 percent accurate, the change map built from them will be noticeably less accurate than either, because a mistake on either date shows up as false change. Careful training data and the same class definitions on both dates are essential.
Time-series analysis
Instead of two dates, use every clear image over several years. Algorithms such as LandTrendr and CCDC fit a model to each pixel's history and flag the moment it breaks from its usual pattern. This separates a gradual decline, such as forest degradation, from a sudden event, such as clear-cutting, and it is much less affected by one unusual image.
Running these methods over large areas used to require serious computing resources. In Google Earth Engine they are now practical for a district or even a whole country.
Machine learning and deep learning
Alternatively, you can train supervised classifiers such as Random Forest directly on stacked before-and-after imagery to label change types. For very high-resolution imagery, deep learning models built on Siamese networks or U-Net architectures detect changes such as new buildings with impressive results. They need substantial labelled training data, so they make most sense for repeated monitoring of the same kind of change.
Worked example: measuring wildfire severity with dNBR
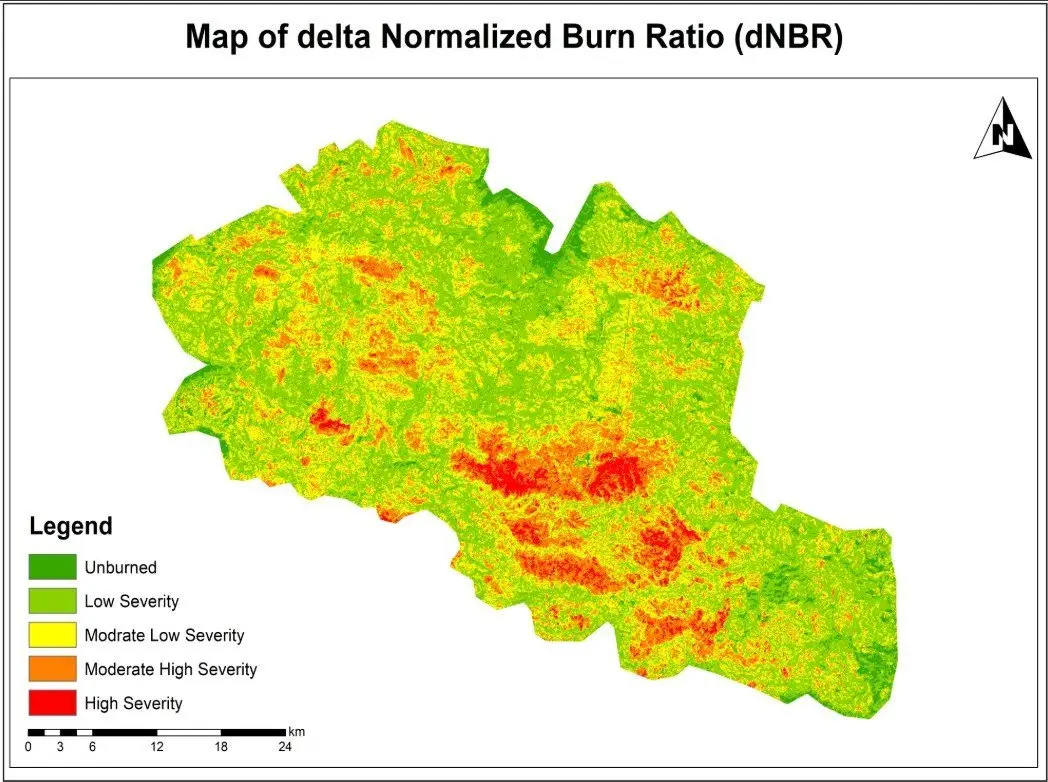
Our wildfire burn severity assessment is a good illustration of index differencing done carefully.
- We selected a clear Sentinel-2 image from before the fire and one from after it, as close to the same season as possible.
- We masked clouds and shadows on both dates.
- Next, we calculated the Normalized Burn Ratio for each date as (B8 − B12) / (B8 + B12).
- Then we calculated dNBR as pre-fire NBR minus post-fire NBR.
- The result was classified into severity classes using the widely used USGS ranges: below 0.1 unburned, 0.1 to 0.27 low, 0.27 to 0.44 moderate-low, 0.44 to 0.66 moderate-high, and above 0.66 high severity.
- Finally, we summarised burned area by severity class for reporting.
The map shows not just where the fire burned but how strongly it affected vegetation in each part of the area. That is what rehabilitation teams need, because high-severity zones are where erosion and slow regrowth are most likely.
Where change detection errors come from
- Phenology. Seasonal greening and drying are the biggest source of false change in vegetated areas.
- Residual cloud, haze and shadow. Even good cloud masks miss thin cirrus and some shadow edges.
- Misregistration. If two images are offset by half a pixel, every field boundary and road edge appears as change. Sentinel-2 and Landsat products already align well, but drone and commercial imagery often need manual alignment.
- Soil moisture and water levels. A wet field after rain looks very different from the same field dry.
- Compounded classification errors in post-classification comparison.
- Mixed pixels. At 30 m, a narrow new road or a small group of houses may only partly fill a pixel, so the analysis can miss it.
Measuring and reporting accuracy
A change map without an accuracy figure is an opinion. The approach we follow is the one that the remote sensing literature recommends and that national forest reporting uses:
- Draw a stratified random sample of points from each map class, including a separate stratum for change so rare changes are sampled well.
- Label each sample point independently using higher-resolution imagery or field data, without looking at the map.
- Build a confusion matrix and calculate overall, producer's and user's accuracy for each class.
- Use the sample to estimate the area of change with a 95 percent confidence interval, rather than simply counting mapped pixels.
The last step matters more than many people realise. Pixel counts inherit bias from the map's errors; sample-based area estimates correct for them. When a client needs to report deforestation or urban expansion to a funder or regulator, this is the figure that should be quoted.
Best practice checklist
- Use same-season images from the same sensor family, in surface reflectance.
- Mask clouds and shadows on every date and check the masks visually.
- Choose the index or method that matches the type of change you are looking for.
- Set thresholds from samples of known change, not by eye.
- Validate with an independent, stratified sample and report area with uncertainty.
- Document every step and parameter so the team can repeat the analysis next year.
Change detection rewards careful preparation more than clever algorithms. If you need change mapping for land cover, floods, fire or urban growth, our remote sensing and land use and land cover teams can design a workflow that gives you numbers you can defend. You can also see our land-cover change mapping project for a full example.
Frequently asked questions
Which satellite is best for change detection?
For most regional work, Sentinel-2 (10 m, roughly 5-day revisit) gives the best balance of detail and frequency. Landsat is the better choice when you need history, because its archive goes back to the 1980s at 30 m. Sentinel-1 radar is the right tool where cloud is persistent, such as monsoon floods. Commercial imagery below 1 m is worth the cost only when the features of interest, such as individual buildings, are smaller than a Sentinel-2 pixel.
How accurate is satellite change detection?
It depends on the type of change. Clear, large changes such as forest clearance, new reservoirs or severe burns often reach overall accuracies above 90 percent. Subtle changes such as forest degradation or crop rotation are much harder. The honest answer for any project is the accuracy measured against independent reference samples, reported with the class-by-class producer's and user's accuracy.
Can change detection be automated?
Yes, once you have tested the method for the area. We usually build the workflow in Google Earth Engine or Python so that every new image goes through exactly the same steps each month or season. Automation still needs a person reviewing flagged changes, at least until the false-alarm rate is known.
How often should we run change detection?
Match the frequency to how fast the change happens and how quickly you need to act. Flood and fire mapping is event-driven and often needed within days. Deforestation alerts are commonly weekly or monthly. Agencies usually report urban growth and land-cover change annually or every few years.
What is the difference between change detection and land-cover change mapping?
Change detection answers whether and where something changed. Land-cover change mapping goes further and labels the transition, for example cropland to built-up land. The second needs a classification for each date, which takes more effort but produces the from–to statistics planners usually ask for.
Related articles
NDVI Explained: How Satellite Vegetation Indices Monitor Crops, Forests and Fire Recovery
What NDVI measures, how it is calculated from Sentinel-2 and Landsat bands, how to interpret values, and how vegetation indices support agriculture and post-fire monitoring.
What Is Remote Sensing? How Satellites Observe the Earth and Why It Matters
A clear introduction to remote sensing and Earth observation: active and passive sensors, spectral bands, Landsat and Sentinel satellites, and real-world applications.