
How satellite change detection works, which methods to use, where errors come from, and how indices such as NBR and dNBR turn imagery into measurable change.

Google Earth Engine Explained: Cloud-Based Satellite Analysis for Faster Geospatial Insights

Key takeaways
- Earth Engine combines a multi-petabyte catalogue of satellite and environmental data with Google's computing, so analysis runs where the data already lives.
- In particular, its strength is time series and large areas: many images, many years, whole regions.
- Specifically, you work in JavaScript in the browser Code Editor or in Python through the earthengine-api and geemap.
- Non-commercial use is free once you register a Google Cloud project, whereas Google Cloud bills commercial use.
- Final cartography and integration with other data usually still happen in QGIS or ArcGIS Pro after export.
Before cloud platforms, a regional satellite study started with a long download. Analysts searched for scenes, downloaded hundreds of gigabytes, mosaicked, corrected and clipped them on a workstation, and only then began the analysis they were actually hired for. Google Earth Engine reversed that order. The data sits on Google's servers, the processing runs there too, and the analyst sends a short script and gets back a map, a chart or a file.
In fact, we use Earth Engine on a large share of our remote sensing projects. This guide explains what it is, how it works under the hood, what it does well and where it does not, and how we take a project from first script to a deliverable a client can use.
What is Google Earth Engine?
Earth Engine is a cloud platform for geospatial analysis at regional to global scale. Overall, it has three parts that matter to users.
- The data catalogue. Several petabytes of ready-to-use data, including the Landsat archive back to the 1970s, Sentinel-1, Sentinel-2 and Sentinel-3, MODIS, climate reanalysis such as ERA5, rainfall products such as CHIRPS, elevation models such as SRTM and Copernicus DEM, and land-cover products such as ESA WorldCover and Dynamic World.
- The processing engine. Earth Engine splits your script into many small tasks and runs them in parallel across Google's infrastructure.
- The interfaces. A browser-based Code Editor using JavaScript, and a Python API that works in Jupyter notebooks and integrates with libraries such as geemap, pandas and scikit-learn.
How Earth Engine works
Images and image collections
An Image is a raster with one or more bands. An ImageCollection is a stack of images, such as every Sentinel-2 scene ever captured. Most scripts start by filtering a collection to an area, a date range and a cloud threshold, then applying the same function to every image with map().
Features and feature collections
Vector data, such as field boundaries, districts or sample points, lives as Features in a FeatureCollection. Analysts then use these to clip imagery, calculate zonal statistics and train classifiers.
Reducers
Reducers summarise data. A temporal reducer such as median() collapses a stack of images into one cloud-free composite. A spatial reducer such as reduceRegions() calculates the mean NDVI, total flooded area or majority land-cover class for each polygon.
Lazy evaluation
Earth Engine does not compute anything until you ask for a result, such as adding a layer to the map, printing a value or starting an export. As a result, Earth Engine processes only the pixels that result needs, at the scale you request. This is why zooming in on the map triggers new computation, and why the same script can feel fast on screen and still take an hour to export a full-resolution result.
Exports
Finally, you export results as batch tasks to Google Drive, Cloud Storage or an Earth Engine asset. Exports run in the background with much higher limits than interactive requests, so they are the right way to produce final outputs.
A short example
This script builds a cloud-masked median Sentinel-2 composite for one year and calculates NDVI. Moreover, it is the starting point for many vegetation and land-cover projects.
var aoi = ee.Geometry.Rectangle([73.9, 31.3, 74.6, 31.8]);

var s2 = ee.ImageCollection('COPERNICUS/S2_SR_HARMONIZED')
  .filterBounds(aoi)
  .filterDate('2025-01-01', '2025-12-31')
  .filter(ee.Filter.lt('CLOUDY_PIXEL_PERCENTAGE', 40));

var csPlus = ee.ImageCollection('GOOGLE/CLOUD_SCORE_PLUS/V1/S2_HARMONIZED');

var composite = s2.linkCollection(csPlus, ['cs'])
  .map(function(img) { return img.updateMask(img.select('cs').gte(0.6)); })
  .median()
  .clip(aoi);

var ndvi = composite.normalizedDifference(['B8', 'B4']).rename('NDVI');
Map.centerObject(aoi, 10);
Map.addLayer(ndvi, {min: 0, max: 0.8, palette: ['brown', 'yellow', 'green']}, 'NDVI');
Similarly, the same dozen lines would apply to a district or a province. After all, that scalability is the main reason Earth Engine has become standard in remote sensing work.
What Google Earth Engine is used for
Vegetation and crop monitoring
Seasonal NDVI and EVI time series for fields, rangeland and forest, with anomalies against a multi-year baseline. Our vegetation condition time series project follows this pattern.
Land-cover classification and change
Random Forest, gradient boosting and other classifiers run directly on composites with training points uploaded as assets. Time-series algorithms such as LandTrendr and CCDC detect when each pixel changed.
Water and flood mapping
Sentinel-1 radar sees through cloud, so it is the main source for flood extents during monsoon events. Optical water indices map reservoirs, wetlands and river migration over decades.
Fire and disaster assessment
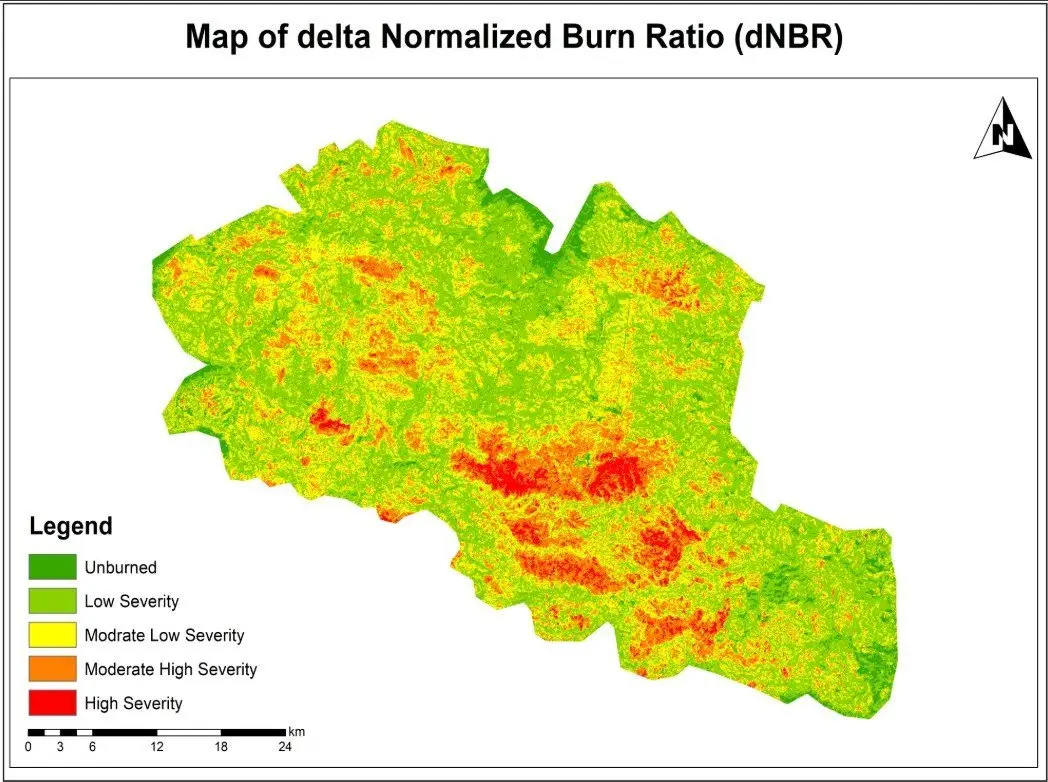
NBR and dNBR for burn severity, before-and-after comparisons for landslides and storm damage, and night-time lights for power outages.
Climate and environmental indicators
Rainfall, temperature and evapotranspiration summaries by district or catchment, combined with land-cover and population data for reporting.
Case example: multi-temporal monitoring
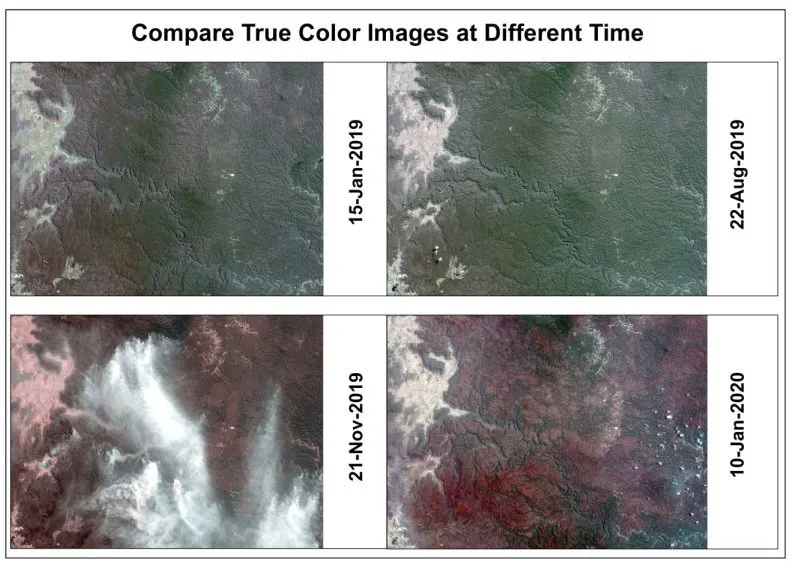
In our multi-temporal satellite monitoring project, we used Earth Engine to filter imagery to the area and season, mask clouds, and build matching true-colour and false-colour composites for four dates. When displayed side by side, the composites made seasonal and surface change easy for non-specialists to follow. Because the whole process is a script, adding a fifth date later means changing one line and running it again.
How we turn a script into a deliverable
- Scope the question. Agree the area, period, indicators and the form of the final output: maps, statistics, a web app or all three.
- Prototype at coarse scale. Test the logic on a small area or at 100 m to get quick feedback.
- Check the data. Inspect individual images, cloud masks and composites. Most errors are visible at this stage.
- Validate. Compare results with reference data, field observations or high-resolution imagery, and record the accuracy.
- Export at full resolution. Run batch exports for rasters and statistics tables.
- Finish in desktop GIS. Produce final cartography in QGIS or ArcGIS Pro and combine with the client's own data.
- Hand over the script. Deliver documented code so that next season the analysis is repeatable by us or by the client's team.
Benefits and limitations
| Strengths | Limitations |
| No downloading or storing of large imagery archives | Requires scripting in JavaScript or Python |
| Scales from one field to a whole country | Interactive requests have time and memory limits |
| Long, analysis-ready time series in one place | Commercial use is paid through Google Cloud |
| Scripts are repeatable and easy to share | Very high-resolution commercial imagery is not included |
| Fast prototyping and visual checking | Final cartography is limited; desktop GIS is still needed |
When not to use Earth Engine
Earth Engine is not the best fit for everything. Very detailed work on drone or sub-metre imagery, complex vector analysis such as network routing, and projects where data must stay on the client's own servers usually work better in desktop GIS, Python on local or cloud machines, or a spatial database such as PostGIS. Therefore, on many projects we use Earth Engine for the heavy raster processing and these tools for everything else.
If you need monitoring that can be repeated every month or season, our Google Earth Engine team can build and document the workflow, or train your staff to run it themselves.
Frequently asked questions
Is Google Earth Engine free?
Earth Engine is free for non-commercial uses such as research, education and work by non-profit organisations, but you need a Google Cloud project registered for non-commercial use, and usage quotas apply. In contrast, commercial and government operational users pay through Google Cloud. Check the current terms before starting a client project, because the licensing tiers have changed several times.
Do I need to know programming?
For anything beyond viewing data, yes. Also, you drive Earth Engine with scripts in JavaScript or Python. However, the good news is that most useful workflows are short, and the official guides and community examples cover the common tasks. As a result, people with some GIS background usually become productive within a few weeks of regular practice.
Can Earth Engine results be used in ArcGIS or QGIS?
Yes. Rasters export as GeoTIFF and tables as CSV, GeoJSON or shapefile to Google Drive or Cloud Storage, and from there into any desktop GIS. QGIS also has a plugin that displays Earth Engine layers directly, and ArcGIS Pro can work with exported data or connect through Python.
What are the main limits I will run into?
Interactive requests in the Code Editor time out after a few minutes and have memory limits, which shows up as "computation timed out" or "user memory limit exceeded" errors. The fix is usually to run the job as a batch export, process a smaller area or coarser scale while testing, or restructure the script so it does less work per step.
Can I upload my own data to Earth Engine?
Yes. You can upload your own rasters and vector files as assets, such as field boundaries, drone orthomosaics or training samples, and use them alongside the public catalogue. Earth Engine can also read large or frequently updated datasets directly from Google Cloud Storage.
Need help applying this to your project?Talk to Spatial Nexus about google earth engine for your area and data.
Related articles
Satellite Change Detection: Methods, Accuracy and Real-World Applications
read more about Satellite Change Detection: Methods, Accuracy and Real-World Applications
How to Choose the Right Coordinate Reference System (CRS) for GIS Projects
A practical guide to coordinate reference systems, map projections, UTM and WGS 84, and how the right CRS keeps distance, area and network analysis accurate.
NDVI Explained: How Satellite Vegetation Indices Monitor Crops, Forests and Fire Recovery
What NDVI measures, how it is calculated from Sentinel-2 and Landsat bands, how to interpret values, and how vegetation indices support agriculture and post-fire monitoring.