
How satellite change detection works, which methods to use, where errors come from, and how indices such as NBR and dNBR turn imagery into measurable change.
Interactive Web GIS Maps vs Static PDF Maps: Which Is Right for Your Project?

Key takeaways
- In short, static PDF maps are best for fixed data, formal reports, printed documents and a single clear message.
- Interactive web maps are worth it when data changes, datasets are large, or many people need different views without GIS software.
- A dashboard is a web map with a job: it pairs the map with counts, charts and filters for a specific operational decision.
- Finally, the ongoing cost of a web map is in keeping the data current, not in the software.
- Many projects need both: a web map for daily use and a set of print-ready maps for reports and approvals.
For a long time, a GIS project ended with a PDF: a carefully composed map with a title, legend, scale bar and north arrow, ready to drop into a report. That format is still valuable. But clients increasingly ask for something they can open on a phone, zoom into their own area and filter by date or category. The question is no longer which format is better in general, but which one suits the data, the audience and the decision the map supports.
This article sets out when each option fits, what a GIS dashboard adds, the realistic costs on both sides, and the steps we follow when planning a web GIS application.
When a static PDF map is the right choice
A static map is a finished argument. In other words, the cartographer decides the extent, scale, symbology and emphasis, and every reader sees the same thing. That is a strength in many situations.
- Formal documents. Environmental assessments, planning applications, tender documents and academic reports need fixed figures that readers can cite and archive.
- Fixed data. If the data will not change after delivery, a web map adds maintenance without adding value.
- Precise cartography. Print layouts allow full control over typography, label placement, colour for print and exact scale, such as 1:25,000 at A3.
- A single message. When the audience needs one clear conclusion, such as the preferred route or the flood zone boundary, open exploration can be a distraction.
- Offline and low-bandwidth use. Moreover, a PDF works anywhere, with no login, no connection and no risk of a broken link in five years.
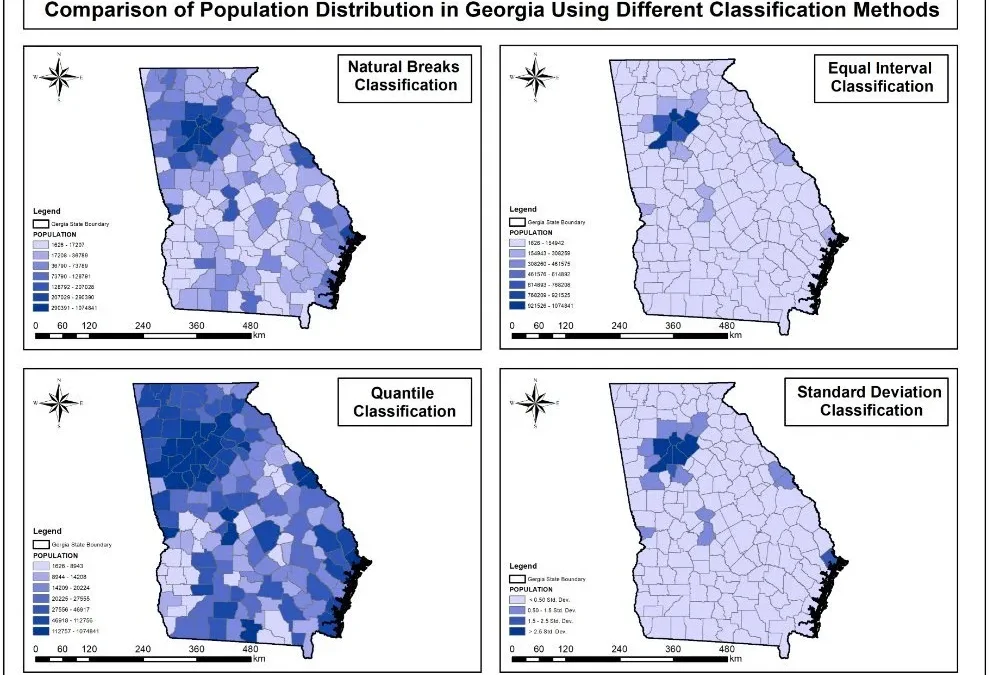
Our cartography work, including the enhanced National Park Service map and the Georgia choropleth map series, shows how much information a carefully designed static map can communicate.
When an interactive web map is better
- Large datasets. For example, one page cannot clearly show thousands of assets, parcels or customers. In contrast, a web map lets users zoom to their area and see full detail there.
- Regularly updated data. Asset condition, permits, monitoring readings and field inspections change weekly or daily. Instead, a web map shows the current state without anyone re-exporting a PDF.
- Different users, different questions. A manager wants a regional summary, a field engineer wants one site. Filters, search and layer controls serve both from the same source.
- No GIS software. In addition, stakeholders open a link in a browser on any device.
- Combining maps with other information. For example, pop-ups can include photos, documents, inspection histories and links to other systems.
Side-by-side comparison
| Static PDF map | Interactive web map | |
| Best for | Reports, approvals, print | Ongoing use, large or changing data |
| Data currency | Fixed at export | Can update live or on a schedule |
| Audience control | Everyone sees the same view | Users choose area, layers and filters |
| Cartographic control | Complete | Good, but varies by screen and zoom |
| Access | Any PDF reader, offline | Browser and internet connection |
| Ongoing cost | None after delivery | Hosting, licences and data upkeep |
| Security | Depends on who receives the file | User accounts, roles and permissions |
GIS dashboards for operational decisions
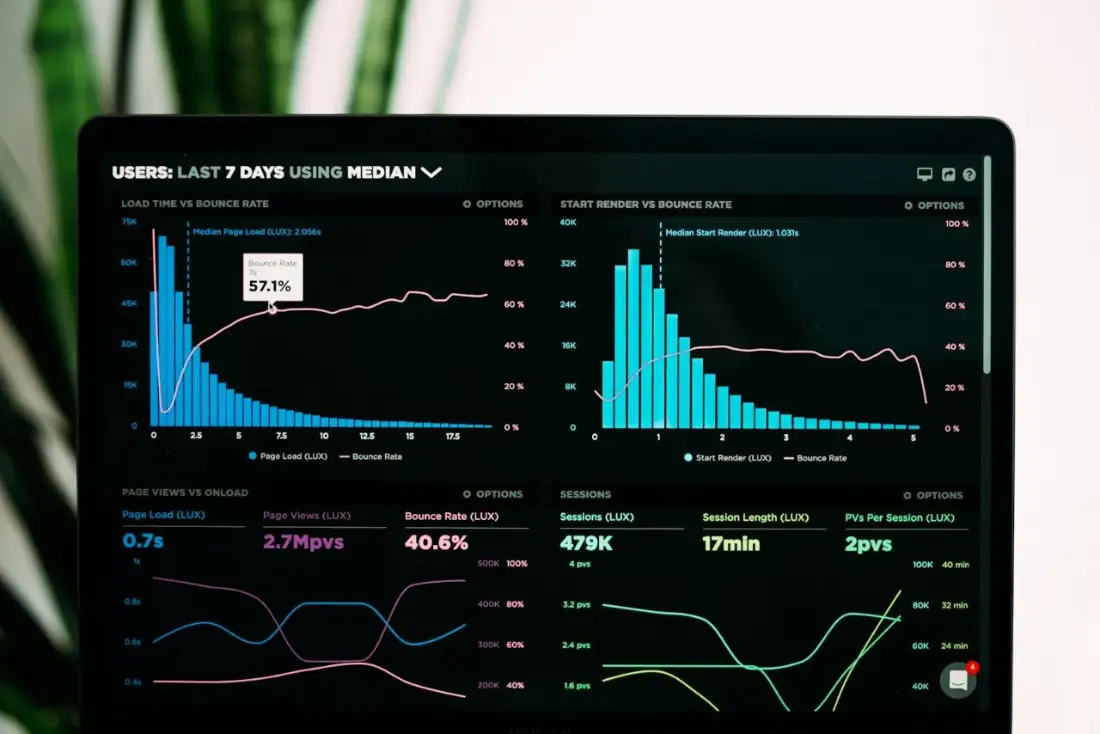
A dashboard is a web map built around a specific job. It places the map next to the numbers a team checks every day: how many sites are overdue for inspection, how many customers sit in each service area, how this month compares with last. For instance, clicking a chart filters the map, and selecting an area on the map updates the charts.
The client and workforce distribution mapping we delivered in Switzerland is a good example of data that becomes more useful as a dashboard. The original deliverable showed where clients and staff clustered. As a dashboard, however, the same data can support weekly decisions about service areas, travel time and recruitment. Our infrastructure asset dashboard follows the same idea for asset condition and maintenance.
In general, good dashboards answer a short list of questions very well. In fact, the most common reason dashboards fail is trying to show everything at once.
What it takes to build each
A static map
Data preparation, design of the layout, symbology and labelling, review with the client, and export at the right resolution (usually 300 dpi for print). After approval, the work ends.
A web map or dashboard
The same data preparation, plus publishing layers as web services, designing pop-ups and filters, testing on desktop and mobile, setting up user access, and agreeing how and when data will be updated. Then, after launch, there is a maintenance phase: data updates, platform updates and occasional changes as users ask for new features.
Planning a web GIS application
1. Start with users and decisions
List who will use the map and what each person needs to decide with it. A short list of user stories, such as "a regional manager checks which sites are overdue for inspection each Monday", shapes every later choice.
2. Prepare and structure the data
Clean geometry, consistent attribute names and values, a sensible coordinate system and clear ownership for each layer. Generally, teams store the data in PostGIS, a file geodatabase or a hosted feature layer, then publish it as web services.
3. Choose the platform
ArcGIS Online, Experience Builder and ArcGIS Dashboards suit organisations already invested in Esri. Open-source stacks built on MapLibre GL JS, Leaflet or OpenLayers, with GeoServer or vector tiles behind them, offer more design freedom and lower licence costs. Above all, the platform should fit the people who will maintain it.
4. Design for clarity and speed
The same cartographic rules apply on screen as on paper: a clear visual hierarchy, restrained colour, readable labels and a legend that explains itself. Speed matters just as much. Also, serve large layers as vector tiles or with scale-dependent visibility so the map loads quickly on a phone.
5. Test with real users
Watching two or three intended users try the map for ten minutes reveals more problems than a week of internal review. Adjust labels, filters and pop-ups based on what they actually do.
6. Plan the handover
Document how the team updates each layer, who has admin access and what to do when something breaks. After all, a web map without an owner goes stale within months.
Often the answer is both
Many of our projects deliver a web map for everyday use and a small set of print-ready maps for reports, presentations and approvals, all built from the same data. As a result, the organisation gets live access without losing the clarity of a finished figure.
If you are deciding between a static deliverable and an interactive one, our web GIS and GIS mapping teams can look at your data and users and recommend the simplest option that will work.
Frequently asked questions
Is a web GIS application expensive to maintain?
Hosting is usually the smaller cost. A simple map on an open-source stack can run on modest cloud hosting, while Esri prices ArcGIS Online by user type and credits. However, the real ongoing cost is data: someone has to update layers, check quality and respond to user requests. Planning who owns each dataset, and how often it changes, matters more than the choice of platform.
Can a web map be printed?
Yes, most platforms include a print tool that exports the current view to PDF or PNG with a title, legend and scale bar. Also, the output is fine for briefings and site visits. For formal reports, planning submissions or large-format prints, we still produce dedicated layouts in ArcGIS Pro or QGIS, because they allow full control over cartography and print resolution.
Can sensitive data be protected?
Yes. Web maps can be private to named users, restricted to an organisation's single sign-on, or published publicly with sensitive layers removed or generalised. Field-level access control, such as showing a client's location but hiding contact details, is also possible. Overall, the right approach depends on who the users are and what the data contains.
Which is better, ArcGIS Online or an open-source web map?
ArcGIS Online and Dashboards are quick to set up, well supported and a natural fit for organisations already using Esri. Open-source stacks such as MapLibre or Leaflet with PostGIS and GeoServer give more design freedom and no per-user licence fees, but need more development time. Therefore, we usually recommend based on the client's existing systems and who will maintain the map after handover.
How long does it take to build a web map?
For example, a straightforward map with a few clean layers and basic pop-ups can be ready in days. A dashboard with live data connections, custom filters and role-based access typically takes several weeks, most of it spent on data preparation and testing with real users.
Need help applying this to your project?Talk to Spatial Nexus about web gis and interactive mapping for your area and data.
Related articles
Satellite Change Detection: Methods, Accuracy and Real-World Applications
read more about Satellite Change Detection: Methods, Accuracy and Real-World Applications
How to Choose the Right Coordinate Reference System (CRS) for GIS Projects
A practical guide to coordinate reference systems, map projections, UTM and WGS 84, and how the right CRS keeps distance, area and network analysis accurate.
NDVI Explained: How Satellite Vegetation Indices Monitor Crops, Forests and Fire Recovery
What NDVI measures, how it is calculated from Sentinel-2 and Landsat bands, how to interpret values, and how vegetation indices support agriculture and post-fire monitoring.