by Spatial Nexus Feb 26, 2026
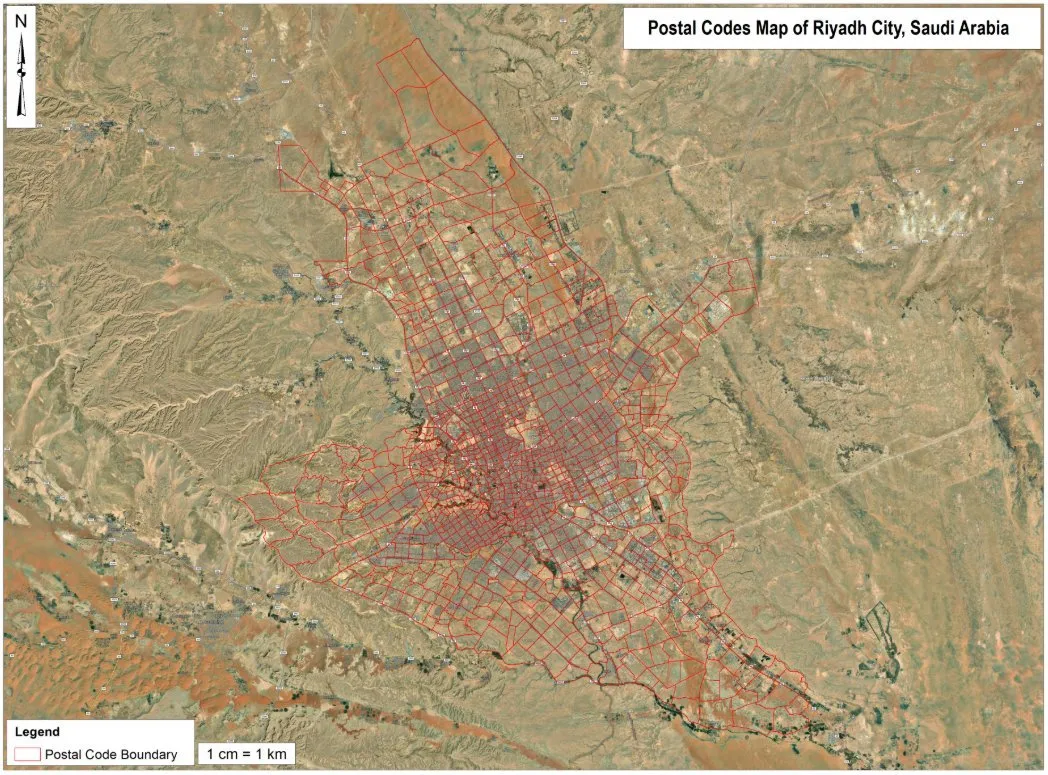
Home › Projects › Web map dashboard for infrastructure assets Asset layers published to a browser-based map with filters and summary panels.
Project overview
Example workflow showing how Spatial Nexus approaches this type of analysis.
Asset layers published to a browser-based map with filters and summary panels.
This page shows a typical Spatial Nexus workflow for this type of analysis.
GIS dashboard infrastructure asset mapping web GIS development utility asset management PostGIS Mapbox Project at a glance
Sector Location Intelligence
Software Mapbox, PostGIS, Trimble, Garmin THE CHALLENGE
What needed solving Asset data was spread across files and hard to share. Managers needed a live overview without GIS software. OBJECTIVES
What the project set out to do Structure asset data for publishing. Build a browser-based map with filters and summaries. 01
Data model Structure asset attributes for publishing.
02
Services Publish layers as web services.
03
Interface Build map, filters and summary panels.
04
Handover Document how to update data.
Select the image to view it at full size.
Interactive asset web map. Filters and summary panels for decision-making. Data model Services Interface Handover Asset location and attribute records Base maps Hosted web map or application Published data services Admin and update guide Source code where agreed
Which platforms can be used? Mapbox, Leaflet, ArcGIS Online or GeoServer, depending on requirements.
Can access be restricted? Yes. Dashboards can require login and role-based access.
by Spatial Nexus Feb 24, 2026
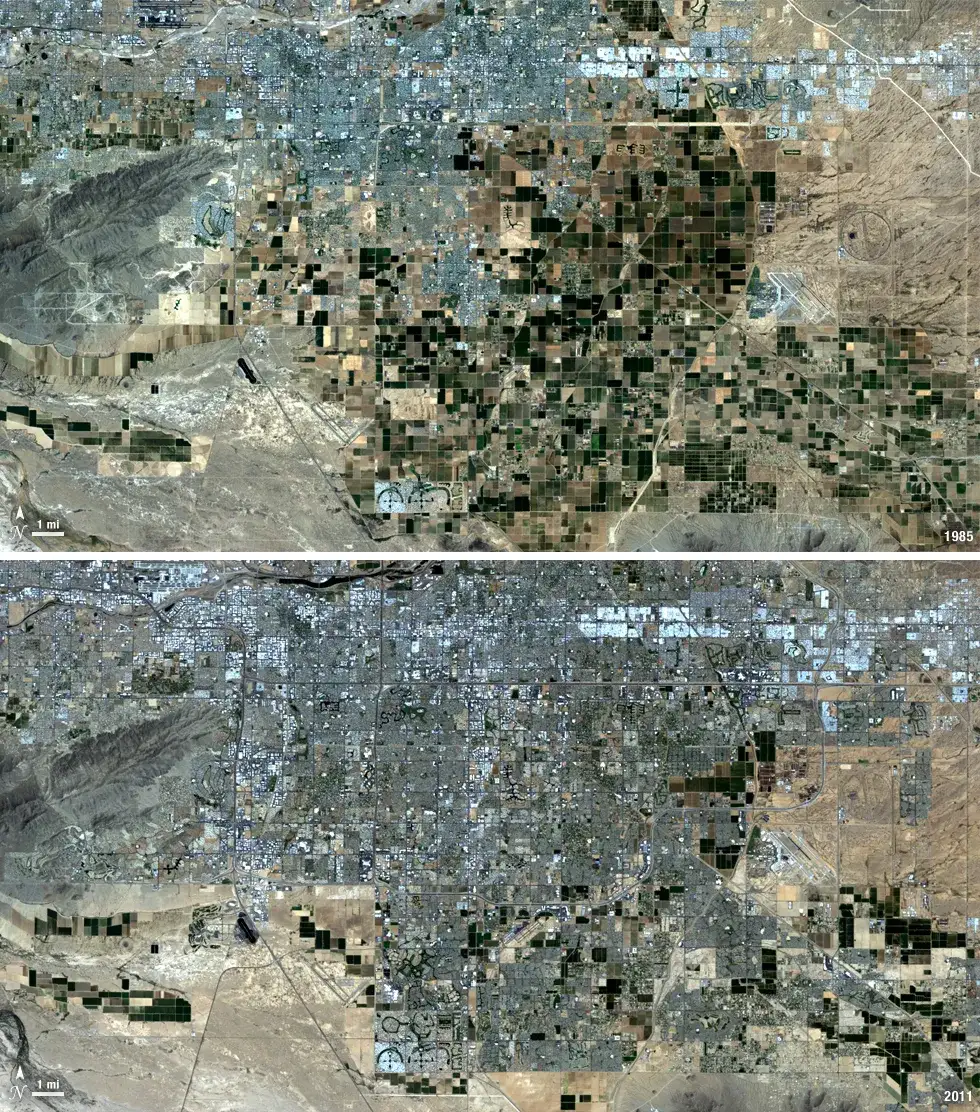
Home › Projects › CAD drawings converted to a GIS asset layer Engineering drawings georeferenced and converted into attributed GIS features.
Project overview
Example workflow showing how Spatial Nexus approaches this type of analysis.
Engineering drawings georeferenced and converted into attributed GIS features.
This page shows a typical Spatial Nexus workflow for this type of analysis.
CAD to GIS conversion georeferencing infrastructure GIS utility mapping AutoCAD ArcGIS integration Project at a glance
Sector Infrastructure
Software AutoCAD, ArcGIS Pro, ArcMap, Global Mapper, Trimble, Leica THE CHALLENGE
What needed solving Engineering drawings were in CAD with no coordinate system. Assets could not be analysed alongside other spatial data. OBJECTIVES
What the project set out to do Georeference CAD drawings. Convert features into attributed GIS layers. 01
Review Check drawing layers, units and coordinate references.
02
Georeference Align drawings to control points.
03
Convert Convert to features and attach attributes.
04
QA Topology and attribute checks.
Select the image to view it at full size.
Georeferenced, attributed asset layers. CAD and GIS exchange files. Review Georeference Convert QA AutoCAD drawings Survey control points Satellite base imagery Georeferenced, attributed GIS layers Contours, slope and hillshade Asset register linked to the map CAD and GIS exchange files
What is georeferencing? Assigning real-world coordinates to drawings or images so they align with other spatial data.
Can GIS data be returned to CAD? Yes. Layers can be exported back to DWG or DXF.
by Spatial Nexus Feb 20, 2026
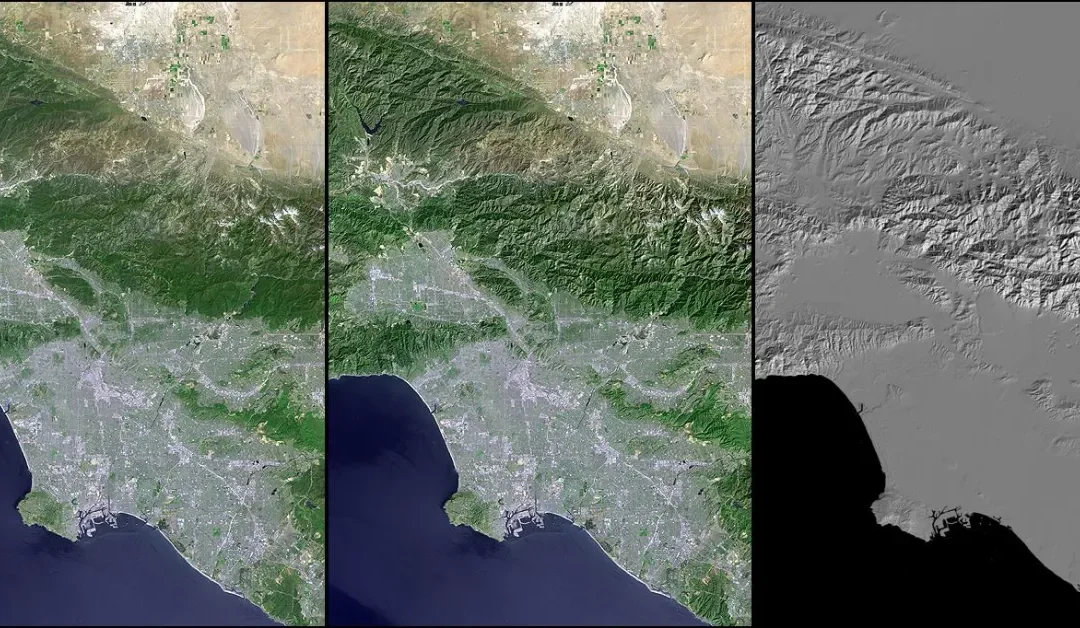
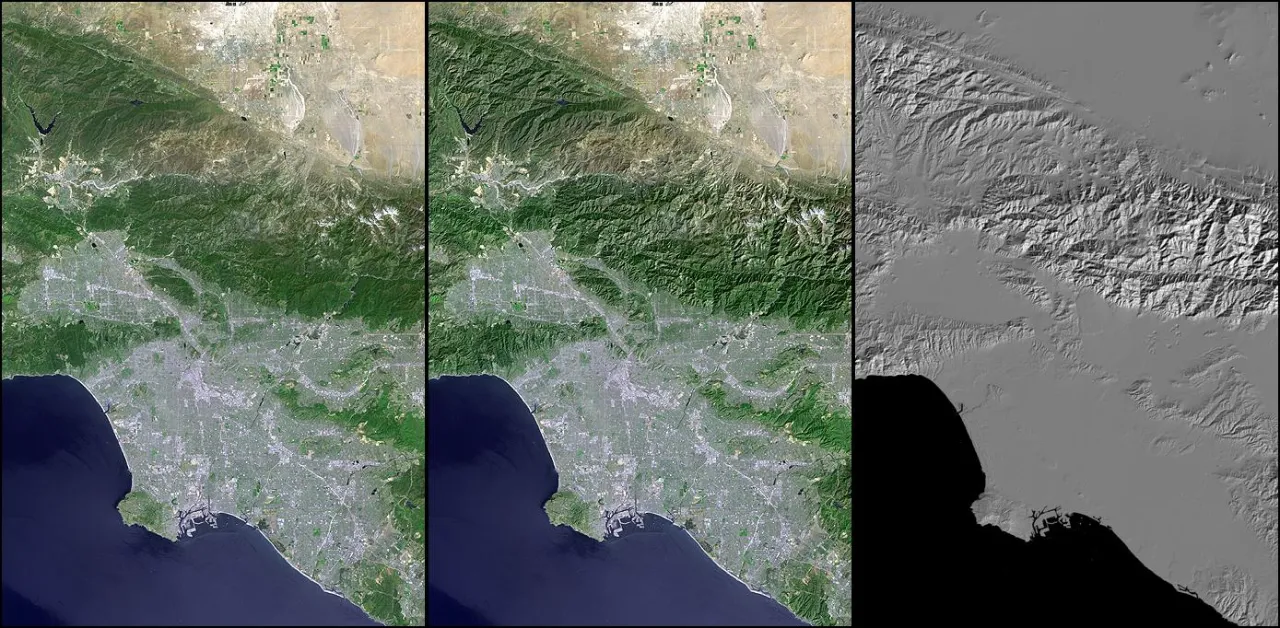
Home › Projects › 3D Terrain Visualization and DEM Analysis for Engineering Planning A 3D terrain model built from a digital elevation model, with hillshade, colour relief and slope analysis to support engineering and infrastructure planning.
Project overview
A 3D terrain model built from a digital elevation model, with hillshade, colour relief and slope analysis to support engineering and infrastructure planning.
3D terrain visualization digital elevation model analysis DEM GIS slope analysis engineering GIS Project at a glance
Client Engineering and infrastructure planning
Sector Infrastructure
Software ArcGIS Pro, Global Mapper, QGIS, Agisoft Metashape, Pix4D, DJI THE CHALLENGE
What needed solving Flat maps made it difficult for stakeholders to understand terrain. Planners needed to see steep areas and valleys before route and site decisions. OBJECTIVES
What the project set out to do Process a digital elevation model for the district. Create a 3D terrain visualisation with colour relief. Derive slope and terrain layers for planning. 01
DEM preparation The elevation model was clipped, filled and projected.
02
Terrain derivatives Hillshade, slope and aspect layers were calculated.
03
3D scene The DEM was rendered in 3D with vertical exaggeration and colour relief.
04
Visual output Views were exported for reports and presentations.
Spatial Nexus map output. Select the image to view it at full size.
A clear 3D terrain view of the study area. Slope and hillshade layers for engineering assessment. Visuals that help non-specialists understand the landscape. 3D DEM visualisation Hillshade and colour relief Slope and aspect analysis Presentation-ready views Digital elevation model (DEM) Administrative boundary Reference imagery 3D terrain visualisation images Slope, aspect and hillshade rasters Processed DEM WHY IT MATTERS
Terrain analysis reduces risk in road, pipeline and site planning by revealing slopes and landforms early in design.
What is a DEM? A digital elevation model is a raster where each cell stores ground height.
Why visualise terrain in 3D? 3D views make slopes, valleys and ridges easy to understand for engineers and stakeholders.
Which data sources can be used? Free global DEMs such as SRTM and Copernicus, or high-resolution LiDAR where available.
by Spatial Nexus Feb 18, 2026
Home › Projects › GIS Data Audit and Workflow Review for an Infrastructure Team A geospatial consultancy engagement reviewing an organisation's GIS data, software and workflows, with a prioritised plan to improve quality and efficiency.
Project overview
Example workflow showing how Spatial Nexus approaches this type of analysis.
A geospatial consultancy engagement reviewing an organisation's GIS data, software and workflows, with a prioritised plan to improve quality and efficiency.
GIS consultancy GIS data audit geospatial workflow review GIS strategy spatial data quality Project at a glance
Client Infrastructure organisation
Sector Infrastructure
Software ArcGIS Pro / QGIS, PostGIS, Python, QGIS THE CHALLENGE
What needed solving Spatial data was stored in many formats with inconsistent attributes. Repetitive manual tasks slowed the GIS team. There was no documented data standard. OBJECTIVES
What the project set out to do Assess data quality, structure and coordinate systems. Review software and workflows. Recommend practical improvements and priorities. 01
Discovery Interviews and a data inventory established how GIS is used.
02
Quality checks Layers were tested for completeness, topology, attributes and CRS.
03
Workflow review Manual tasks suitable for automation were identified.
04
Roadmap Findings were turned into a prioritised improvement plan.
Select the image to view it at full size.
A clear picture of data strengths and gaps. Recommended data standard and folder structure. A list of automation opportunities. Independent expert review Data quality assessment Automation opportunities Prioritised roadmap Existing GIS layers and databases CAD drawings Interviews with GIS users Audit report Data standard recommendations Improvement roadmap WHY IT MATTERS
A structured review helps teams fix data problems at the source and focus effort where it saves the most time.
Do you need access to our systems? Usually a copy of key datasets and short interviews are enough.
Can you help implement the recommendations? Yes. We can support implementation or train your team.