GIS Data Visualization Specialist for Choropleth Map Series Using ArcGIS 10.8

GIS Data Visualization Specialist for Choropleth Map Series Using ArcGIS 10.8

GIS Data Visualization Specialist for Choropleth Map Series Using ArcGIS 10.8

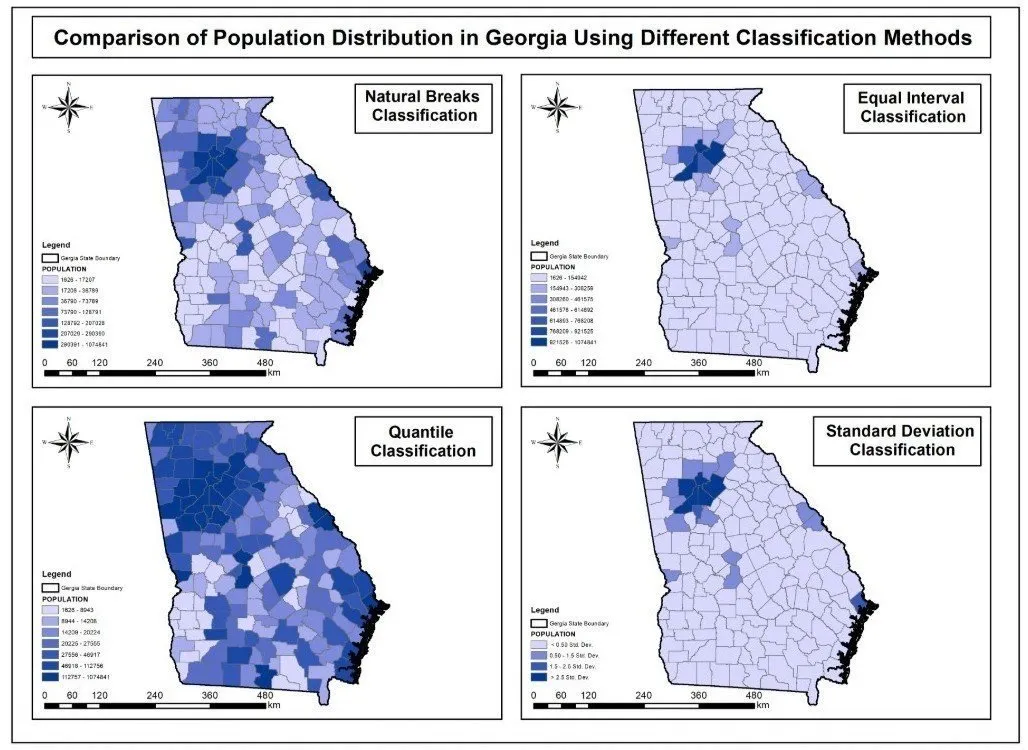
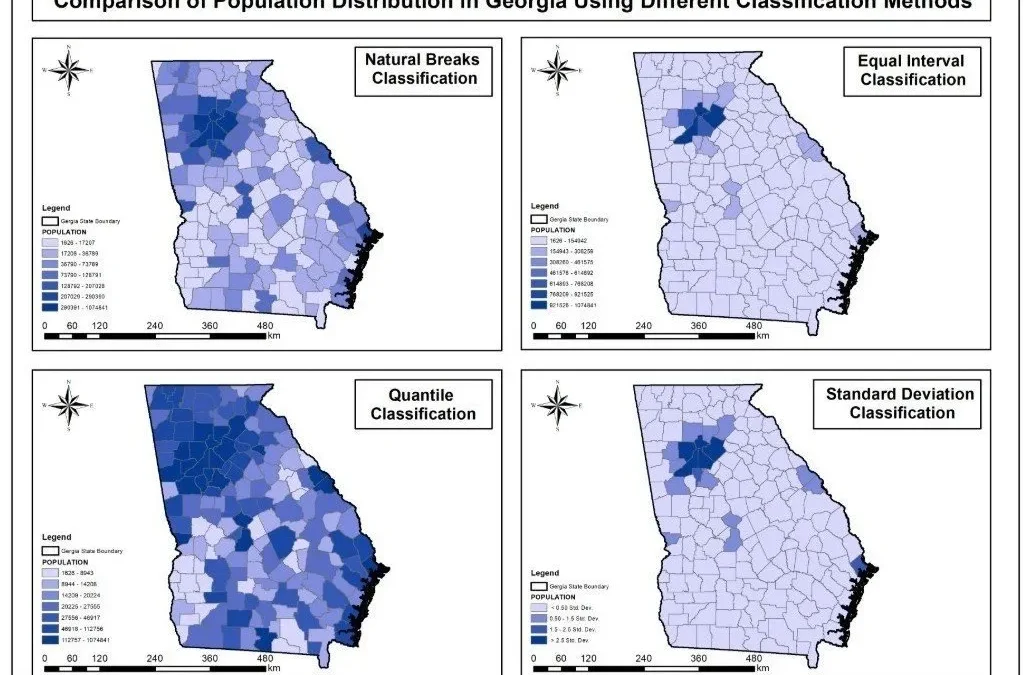
A comparative choropleth map series of population across all 159 Georgia counties, showing how four classification methods change the interpretation of the same census data.

About this project

Project overview

Data visualization plays a critical role in transforming raw demographic data into meaningful spatial insights. In this project, Spatial Nexus delivered a comprehensive choropleth mapping solution using population data from the U.S. Census Bureau, focusing on all 159 counties in Georgia.

As a GIS Analyst, the objective was to design a comparative choropleth map series that highlights how different classification methods influence the interpretation of spatial patterns. Using ArcGIS 10.8, four distinct maps were created to ensure analytical depth and visual consistency.

  • choropleth map
  • GIS data visualization
  • ArcGIS classification methods
  • natural breaks Jenks
  • census population mapping

Project at a glance

Client
Research and data visualisation
Sector
Demographics
Location
Georgia, USA (159 counties)
Software
ArcGIS 10.8, Population Data, GIS Classification Techniques

THE CHALLENGE

What needed solving

  • The same population data can tell very different stories depending on how it is classified.
  • Non-specialists rarely see how classification choices influence a map.
  • Four maps needed identical styling so differences came only from the method.

OBJECTIVES

What the project set out to do

  • Map population for all 159 counties in Georgia, USA.
  • Compare Equal Interval, Quantile, Natural Breaks (Jenks) and Standard Deviation classification.
  • Keep consistent cartographic design across the series.
  • Deliver a clean, professional PDF map series.

Methodology

Our workflow, step by step

01

Data preparation

Census population figures were joined to county boundaries and checked for completeness.

02

Classification

Four maps were produced using Equal Interval, Quantile, Natural Breaks (Jenks) and Standard Deviation methods.

03

Consistent styling

A shared colour scheme, legend design and layout ensured a fair visual comparison.

04

Layout and export

The four maps were arranged in a single comparative series and exported as a high-quality PDF.

Visual output

The map

Select the image to view it at full size.

GIS Data Visualization Specialist for Choropleth Map Series Using ArcGIS 10.8, map output

Results

What the analysis delivered

  • A side-by-side series that shows clearly how classification shapes interpretation.
  • Natural Breaks and Quantile maps highlight different patterns from the same data.
  • A reusable reference for teaching and reporting on thematic mapping.

Key highlights

Why this project stands out

  • Four classification methods compared
  • All 159 Georgia counties
  • Consistent professional styling
  • High-quality PDF deliverable

Data sources

Data used

  • U.S. Census Bureau population data
  • Georgia county boundaries (159 counties)

Tools and technologies

Software and methods

ArcGIS 10.8Spatial analysis and map production
Population DataU.S. Census Bureau
GIS Classification TechniquesStatistical data grouping and visualization

Deliverables

What the client received

  • Comparative choropleth map series (PDF)
  • Prepared GIS dataset
  • Classification notes

WHY IT MATTERS

Choosing the right classification method prevents misleading maps. This series makes those choices transparent for analysts, students and decision-makers.

FAQ

Questions about this project

What is a choropleth map?

A thematic map that shades areas such as counties according to a data value, for example population.

Which classification method is best?

It depends on the data distribution and purpose. Natural Breaks suits clustered data, Quantile gives equal counts per class, and Equal Interval is easiest to read.

Which software was used?

ArcGIS 10.8 for analysis, classification and map production.

Planning a similar geospatial project?

Employment Density Mapping of Dübendorf City Using GIS & Kernel Density Analysis

Employment Density Mapping of Dübendorf City Using GIS & Kernel Density Analysis

Employment Density Mapping of Dübendorf City Using GIS & Kernel Density Analysis

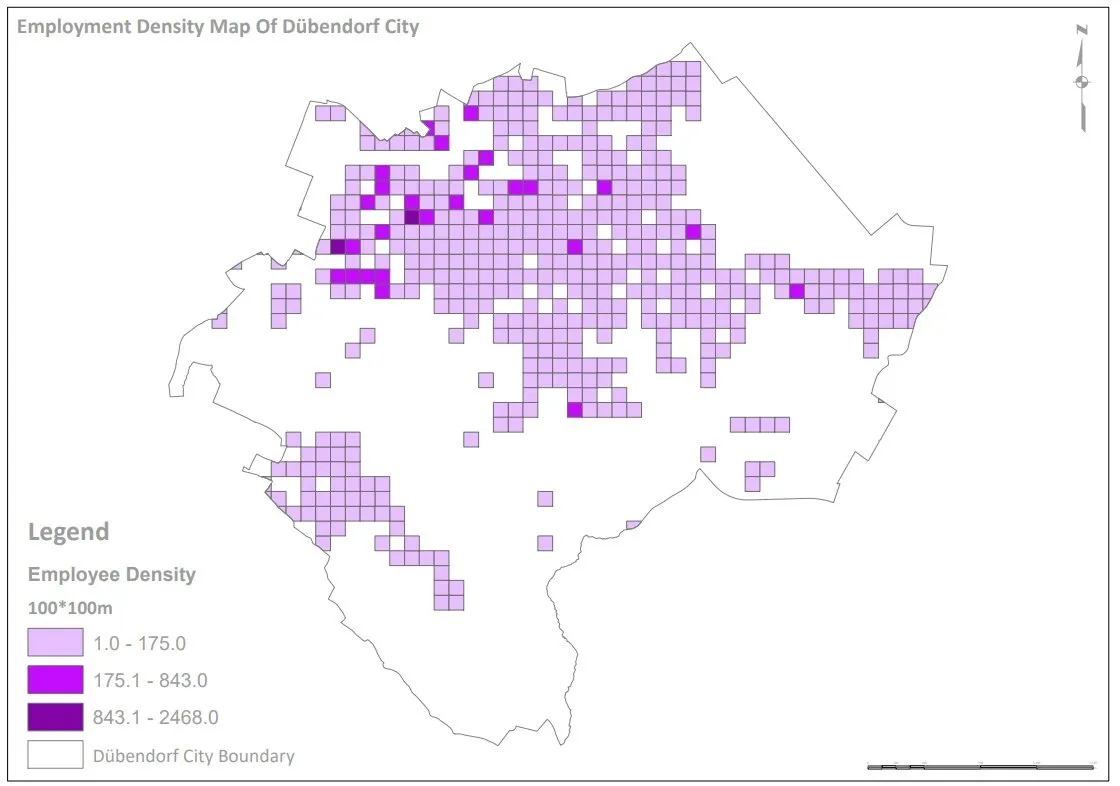
A GIS-based employment density map of Dübendorf, Switzerland, using Kernel Density Estimation to reveal where jobs concentrate and support urban and economic planning.

About this project

Project overview

Understanding the spatial distribution of employment is critical for effective urban planning and economic development. In this project, Spatial Nexus developed a comprehensive employment density map for Dübendorf, transforming complex datasets into actionable geospatial insights.

The objective was to analyze and visualize the concentration of employment opportunities across the city, enabling planners, policymakers, and businesses to better understand the local economic landscape. By leveraging advanced GIS techniques, the project delivers a clear and data-driven representation of urban employment patterns.

  • employment density mapping
  • kernel density estimation GIS
  • urban planning GIS
  • economic geography analysis
  • ArcGIS QGIS spatial analysis

Project at a glance

Client
Urban planning and economic development
Sector
Urban Planning
Location
Dübendorf, Switzerland
Software
ArcGIS, QGIS, GIS Datasets, Microsoft Office

THE CHALLENGE

What needed solving

  • Employment, business and demographic data were held in separate tables with no spatial view.
  • Planners could not see where jobs clustered or how employment related to transport and land use.
  • Point-based records were too dense to interpret directly on a map.

OBJECTIVES

What the project set out to do

  • Map the spatial distribution of employment across the city.
  • Identify employment hotspots and lower-density areas.
  • Relate job concentrations to transport networks and land-use zones.
  • Deliver a clear, presentation-ready map for decision-makers.

Methodology

Our workflow, step by step

01

Data integration

Business, employment and demographic records were cleaned, geocoded and joined into one spatial database.

02

Projection and preparation

All layers were projected to a metric coordinate system so distances and search radii were accurate.

03

Kernel Density Estimation

KDE converted employment points into a continuous density surface, weighted by number of jobs.

04

Overlay analysis

The density surface was overlaid with transport and land-use layers to interpret why hotspots occur.

05

Cartographic design

A clear colour ramp, legend and context layers produced a readable, professional map.

Visual output

The map

Select the image to view it at full size.

Employment Density Mapping of Dübendorf City Using GIS & Kernel Density Analysis, map output

Results

What the analysis delivered

  • Clear identification of the main employment centres in Dübendorf.
  • Visible relationship between job clusters, transport corridors and commercial zoning.
  • Evidence base for infrastructure, transport and economic development planning.

Key highlights

Why this project stands out

  • Kernel Density Estimation weighted by employment
  • Integration of business, demographic and land-use data
  • Transport and zoning overlays
  • Presentation-ready cartography

Data sources

Data used

  • Employment and business location records
  • Demographic datasets
  • Land-use zoning layers
  • Transport network data

Tools and technologies

Software and methods

ArcGISSpatial analysis and density modeling
QGISData processing and visualization
GIS DatasetsEmployment, demographics, land use, and transport networks
Microsoft OfficeReporting and data management

Deliverables

What the client received

  • Employment density map (print and digital)
  • Processed GIS datasets
  • Density raster surface
  • Methodology summary

WHY IT MATTERS

Employment density mapping gives planners an objective view of where economic activity happens, supporting decisions on transport investment, zoning and business development.

FAQ

Questions about this project

What is kernel density estimation in GIS?

KDE turns individual point locations into a smooth surface that shows how concentrated features are across an area, here weighted by the number of jobs at each location.

Which software was used?

ArcGIS for spatial analysis and density modelling, and QGIS for data processing and visualisation.

Can this analysis be applied to other cities?

Yes. The same workflow works for any city with geocoded employment or business data.

Planning a similar geospatial project?

Client & Workforce Distribution Mapping Using GIS (Switzerland)

Client & Workforce Distribution Mapping Using GIS (Switzerland)

Client & Workforce Distribution Mapping Using GIS (Switzerland)

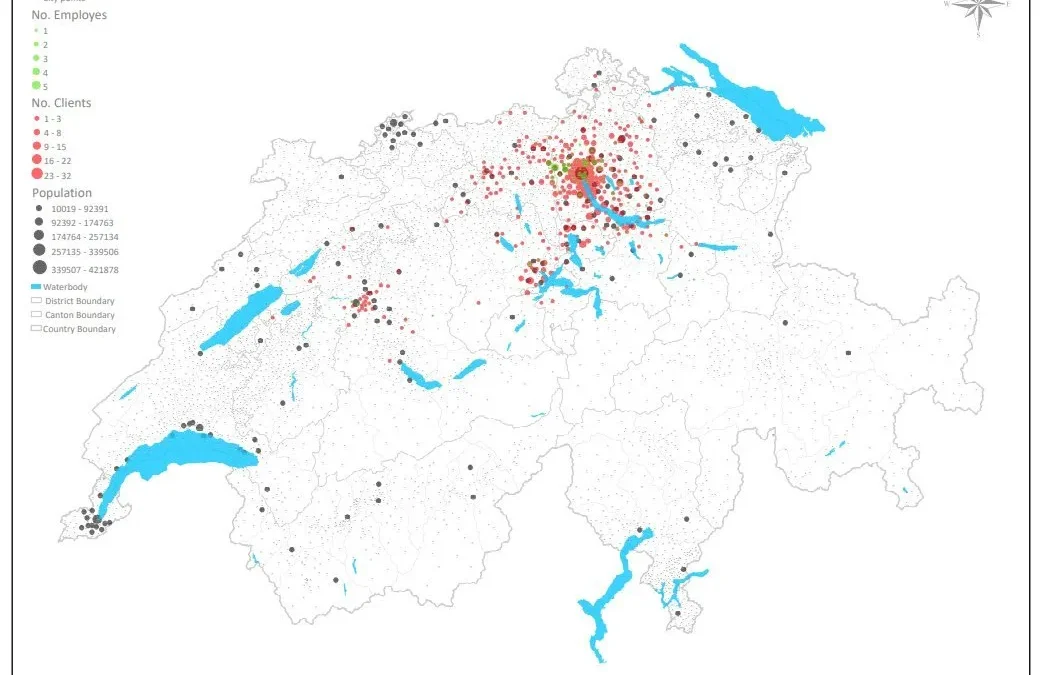
A GIS strategy map for a Swiss cleaning services company, visualising client locations and workforce distribution to optimise service areas and operations.

About this project

Project overview

Understanding the spatial relationship between clients and workforce is critical for operational efficiency and service optimization. In this project, Spatial Nexus developed a comprehensive GIS-based strategy map for a cleaning services company in Switzerland, enabling clear visualization of client locations and employee distribution.

The objective was to transform raw operational data into an intelligent geospatial framework that supports data-driven decision-making and service area optimization.

  • location intelligence
  • client distribution mapping
  • workforce optimization GIS
  • service area planning
  • cluster analysis GIS

Project at a glance

Client
Cleaning services company
Sector
Business Services
Location
Switzerland
Software
ArcGIS, QGIS, GIS Infographic Tools, Microsoft Office

THE CHALLENGE

What needed solving

  • Client and employee addresses existed only as lists.
  • Management could not see where demand and staff were concentrated.
  • Service areas and travel were planned without spatial evidence.

OBJECTIVES

What the project set out to do

  • Map all client and workforce locations.
  • Identify clusters of demand and staff.
  • Support service-area planning and operational efficiency.

Methodology

Our workflow, step by step

01

Data structuring

Client and staff records were cleaned and geocoded.

02

Spatial mapping

Locations were mapped with distinct, colour-coded symbology.

03

Cluster analysis

Clusters of clients and workforce were identified to show demand and coverage.

04

Strategy map design

Results were combined into an infographic-style strategy map for management.

Visual output

The map

Select the image to view it at full size.

Client & Workforce Distribution Mapping Using GIS (Switzerland), map output

Results

What the analysis delivered

  • Clear view of where clients and staff are concentrated.
  • Identification of areas where workforce and demand are well or poorly matched.
  • A basis for service-area optimisation and reduced travel time.

Key highlights

Why this project stands out

  • Cluster-based visualisation of clients and workforce
  • Colour-coded, intuitive mapping
  • Scalable approach for growing operations
  • Business intelligence powered by GIS

Data sources

Data used

  • Client location records
  • Employee location records
  • Swiss administrative and reference layers

Tools and technologies

Software and methods

ArcGISSpatial analysis and mapping
QGISData processing and visualization
GIS Infographic ToolsCluster-based visualization
Microsoft OfficeData structuring and reporting

Deliverables

What the client received

  • Client and workforce strategy map
  • Geocoded GIS datasets
  • Cluster summary

WHY IT MATTERS

Location intelligence lets service companies place staff closer to demand, cutting travel and improving response times.

FAQ

Questions about this project

What is location intelligence?

The use of maps and spatial analysis to inform business decisions such as where to serve customers or place staff.

Is client data kept confidential?

Yes. Client details are handled securely and are not published.

Can the map be turned into a live dashboard?

Yes. The same data can power an interactive web map or GIS dashboard.

Planning a similar geospatial project?

Multi-criteria site suitability for a public facility

Multi-criteria site suitability for a public facility

Multi-criteria site suitability for a public facility

Access, slope, land use and constraints combined into a ranked suitability surface.

About this project

Project overview

Example workflow showing how Spatial Nexus approaches this type of analysis.

Access, slope, land use and constraints combined into a ranked suitability surface.

This page shows a typical Spatial Nexus workflow for this type of analysis.

  • site suitability analysis
  • multi-criteria decision analysis GIS
  • site selection GIS
  • weighted overlay
  • public facility planning

Project at a glance

Sector
Spatial Analysis
Software
ArcGIS Pro, Network Analyst, QGIS, Python

THE CHALLENGE

What needed solving

  • Choosing a facility site involves many competing criteria.
  • Decisions must be transparent and defensible.

OBJECTIVES

What the project set out to do

  • Agree criteria and weights with stakeholders.
  • Produce a ranked suitability surface.
  • Shortlist candidate sites.

Methodology

Our workflow, step by step

01

Criteria

Agree criteria, constraints and weights with the client.

02

Data preparation

Standardise each criterion to a common scale.

03

Overlay

Weighted overlay and constraint masking.

04

Ranking

Shortlist and compare candidate sites.

Visual output

The map

Select the image to view it at full size.

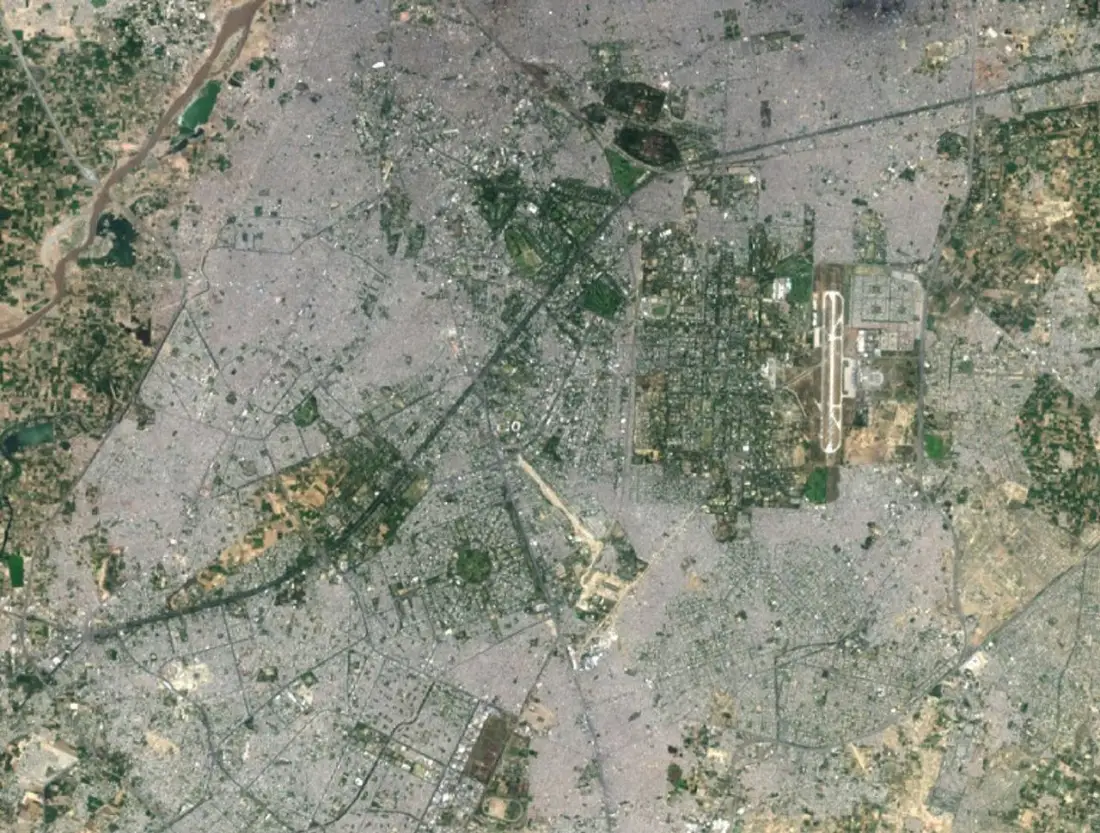
Landsat 8 close view of central Lahore showing built-up areas and green spaces

Results

What the analysis delivered

  • Suitability map ranking locations.
  • Shortlist of candidate sites.
  • Documented criteria and weights.

Key highlights

Why this project stands out

  • Criteria
  • Data preparation
  • Overlay
  • Ranking

Data sources

Data used

  • Road network and accessibility
  • Slope from elevation data
  • Land use and constraints

Tools and technologies

Software and methods

ArcGIS Pro
Network Analyst
QGIS
Python

Deliverables

What the client received

  • Suitability or ranking maps
  • Criteria and weighting documentation
  • Scenario comparisons
  • Short decision report

FAQ

Questions about this project

What is multi-criteria analysis?

A method that combines several weighted factors, such as access and slope, into one suitability score.

Can weights be changed?

Yes. Scenarios can be rerun with different weights to test sensitivity.

Planning a similar geospatial project?

CAD drawings converted to a GIS asset layer

CAD drawings converted to a GIS asset layer

CAD drawings converted to a GIS asset layer

Engineering drawings georeferenced and converted into attributed GIS features.

About this project

Project overview

Example workflow showing how Spatial Nexus approaches this type of analysis.

Engineering drawings georeferenced and converted into attributed GIS features.

This page shows a typical Spatial Nexus workflow for this type of analysis.

  • CAD to GIS conversion
  • georeferencing
  • infrastructure GIS
  • utility mapping
  • AutoCAD ArcGIS integration

Project at a glance

Sector
Infrastructure
Software
AutoCAD, ArcGIS Pro, ArcMap, Global Mapper, Trimble, Leica

THE CHALLENGE

What needed solving

  • Engineering drawings were in CAD with no coordinate system.
  • Assets could not be analysed alongside other spatial data.

OBJECTIVES

What the project set out to do

  • Georeference CAD drawings.
  • Convert features into attributed GIS layers.

Methodology

Our workflow, step by step

01

Review

Check drawing layers, units and coordinate references.

02

Georeference

Align drawings to control points.

03

Convert

Convert to features and attach attributes.

04

QA

Topology and attribute checks.

Visual output

The map

Select the image to view it at full size.

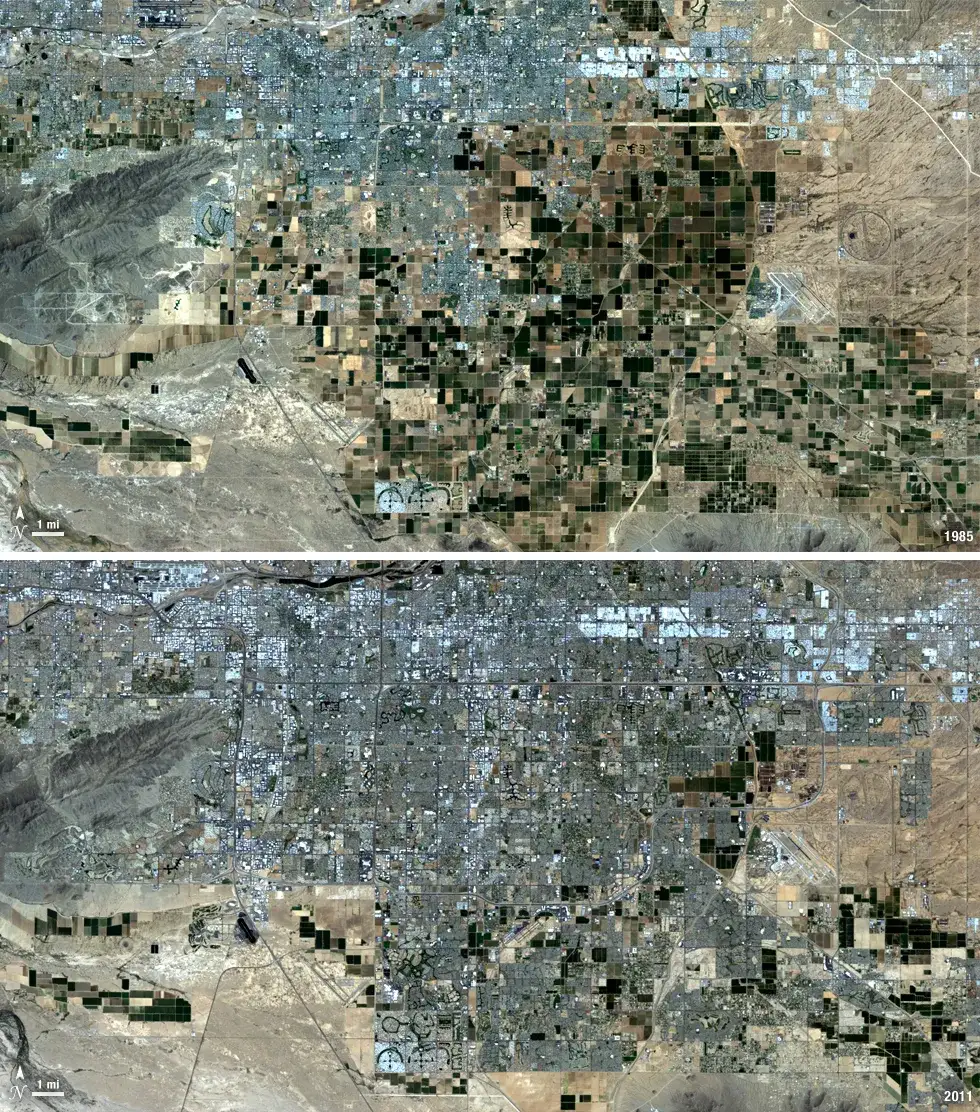
Landsat images of Chandler, Arizona, showing farmland converted to urban parcels and roads

Results

What the analysis delivered

  • Georeferenced, attributed asset layers.
  • CAD and GIS exchange files.

Key highlights

Why this project stands out

  • Review
  • Georeference
  • Convert
  • QA

Data sources

Data used

  • AutoCAD drawings
  • Survey control points
  • Satellite base imagery

Tools and technologies

Software and methods

AutoCAD
ArcGIS Pro
ArcMap
Global Mapper
Trimble
Leica

Deliverables

What the client received

  • Georeferenced, attributed GIS layers
  • Contours, slope and hillshade
  • Asset register linked to the map
  • CAD and GIS exchange files

FAQ

Questions about this project

What is georeferencing?

Assigning real-world coordinates to drawings or images so they align with other spatial data.

Can GIS data be returned to CAD?

Yes. Layers can be exported back to DWG or DXF.

Planning a similar geospatial project?